
The difficult thing about tables, in general, is that creating them by hand takes basically the same amount of time as updating them later on. We’d all rather make tables a one-off task and have everything kept up to date automatically.
With Visualizer, you can choose to fetch data for your table from a URL and then set the import to repeat every hour / 12 hours / day / three days.
What this effectively means is that you get a table that refreshes itself automatically based on the changes of the source. Read: there’s no need to come back to it and update it by hand.
Here are four creative ways you can take advantage of that:
Keep your case studies or analysis posts up to date (automatically)
We’ve been heavy into the WordPress hosting market. We have a number of posts on the topic, and most of them require ongoing updates.
One of the versions of our main hosting comparison includes a live table that highlights the load times of the hosts featured. It looks like this (live table):
(You might not see it in action if you go to that post now; we change that one around pretty frequently, testing a lot of things.)
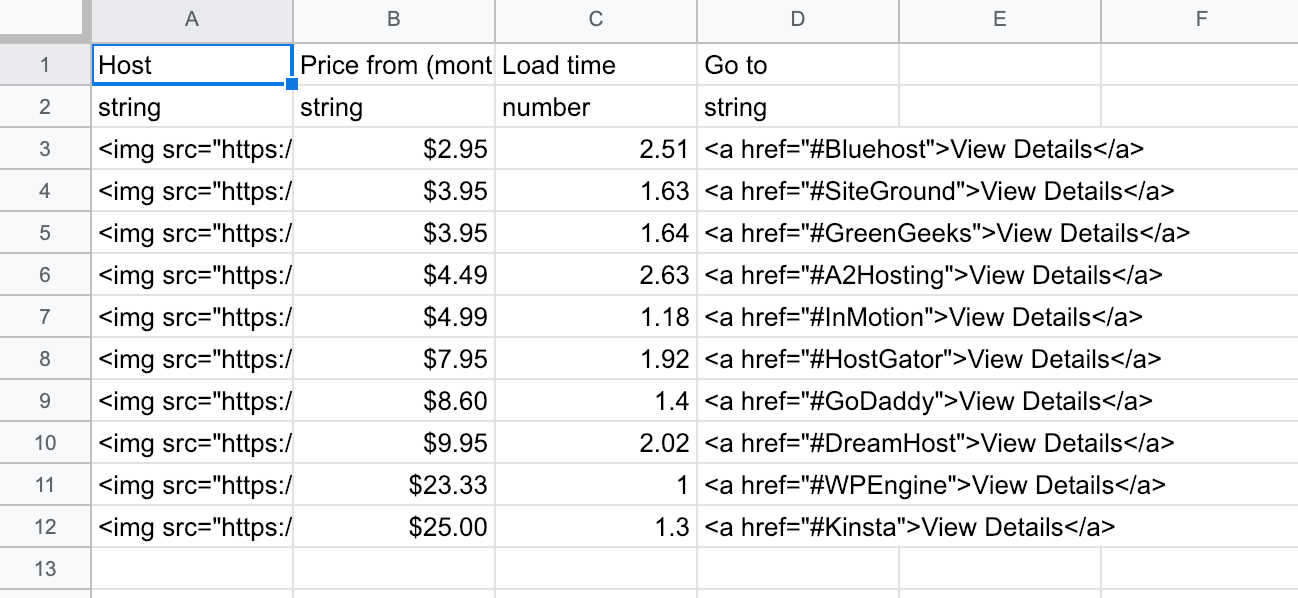
This whole table is fetched automatically from Google Sheets. Even the logos and links are stored inside Google Sheets (as raw HTML). Whenever we update the load times, for example, they get updated in the table as well. Not to mention, the user can sort the table.
Setting this up isn’t difficult at all:
1. Prepare your Google Sheet

2. Create a table in Visualizer
Go to Media → Visualizer Library and click on Add New. Pick Table.
From the setup window, select Import data from URL, go into Schedule Import and then enter the URL of the import and the schedule. Like so:
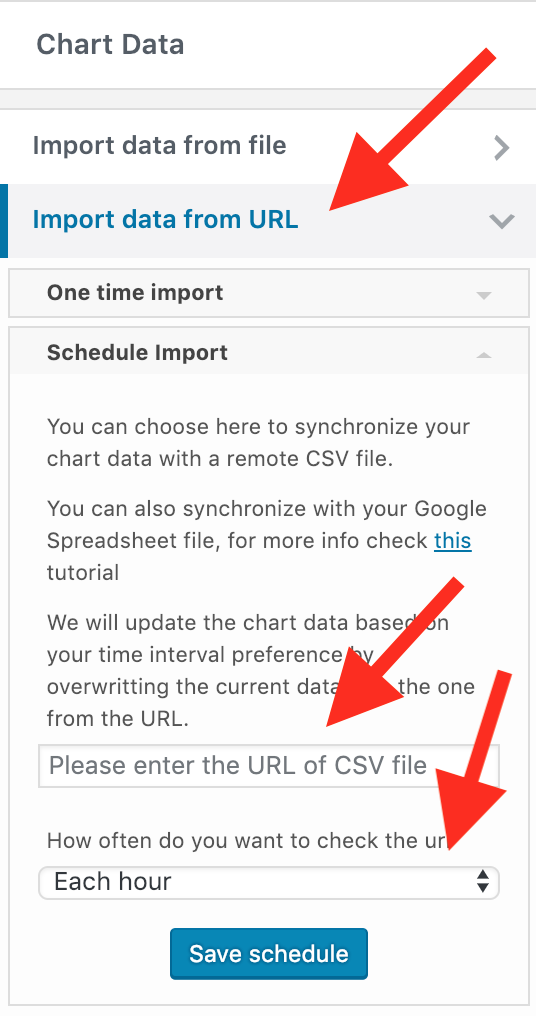

Save the table.
Again, with this setup, you can fetch data for tables automatically and then also have those tables update automatically.
Keep multiple tables up to date across multiple posts (automatically)
This is related to the previous scenario, but the angle is a bit different.
Basically, nothing’s stopping you from using the same Google Sheet as the source of data for multiple tables.
What this means is that you can include similar tables across multiple posts/pages and not have to worry that they’re going to drift out of sync over time (say, you’ll update one but forget to update the other, etc.).
When setting up your table in Visualizer, you can go into advanced settings and adjust various things like pagination, number of rows, disable/enable user sorting, enable search, and so on. This means that your tables can still look different even though they use the same data source.
Keep your traffic/users/sales numbers up to date (automatically)
There’s been a trend among web businesses to share various numbers/indicators such as traffic, sales, number of users served, etc. on their websites.
However, not everyone wants to embed external services and thus not be able to moderate them in any way.
Ideally, even if you’re very transparent, you still don’t want to wake up and find out that an embed from your shopping cart or traffic tool is showing a huge drop – while your headline might still say “look how well we’re doing!”
If you add another layer and import the data to a Google Sheet first, then you can moderate all changes before they get fetched into a traffic/sales table and go live on the site.
The setup is the same as in the previous scenarios. Just create a new Google Sheet, import or enter your numbers, and then hook it up to a Visualizer table or chart.
Query your database (automatically)
Visualizer has one more cool feature up its sleeve; it can import table data right from your WordPress database via a raw SQL query.
Fairly advanced stuff, yes, but also gives you a lot of possibilities if you’re willing to experiment.
Some quick ideas:
First, you can easily showcase your most commented-on posts. You can use such a list not only in transparency reports but also on your archives page. Example:
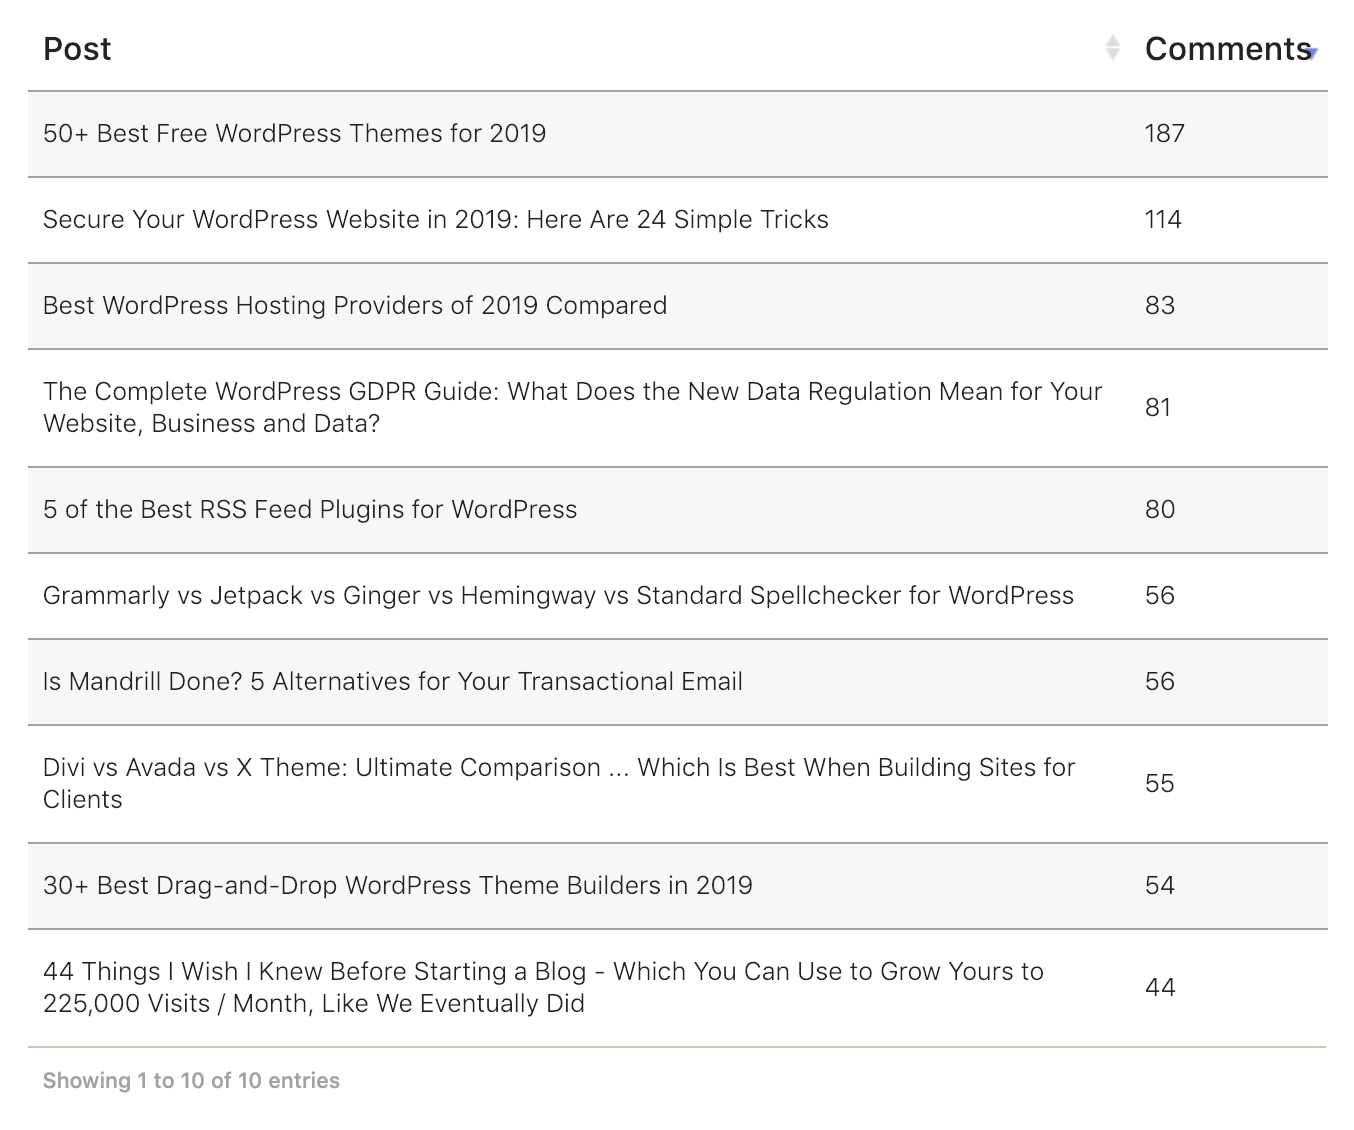

To build a table like that, simply go into Visualizer, create a new table, and select Import from database.
In the query window, you can put something like this:
SELECT post_title AS Post, COUNT(DISTINCT c.comment_ID) AS Comments FROM wp_posts p LEFT JOIN wp_comments c ON p.id = c.comment_post_ID GROUP BY p.ID ORDER BY Comments DESC LIMIT 10
This will showcase a table of your top 10 most commented-on posts.
You can complicate the query to also get the URL, so that you can make those post titles live. This is just an example. Here are some other things you can do:
- list all your posts from a certain category or written by an author
- look into tables that other plugins use to store their data, fetch relevant data from them
- display your bestselling products from WooCommerce, along with the number of sales, links, prices, whatever else you wish
- do the same with Easy Digital Downloads; here are some ready-made queries
That’s about it when it comes to Visualizer and how we’re using it. But there are also other solutions if you don’t need this sort of advanced automation:
Use TablePress for reliable sorting and table edits
We’re also big fans of TablePress and been using it in a number of our posts.
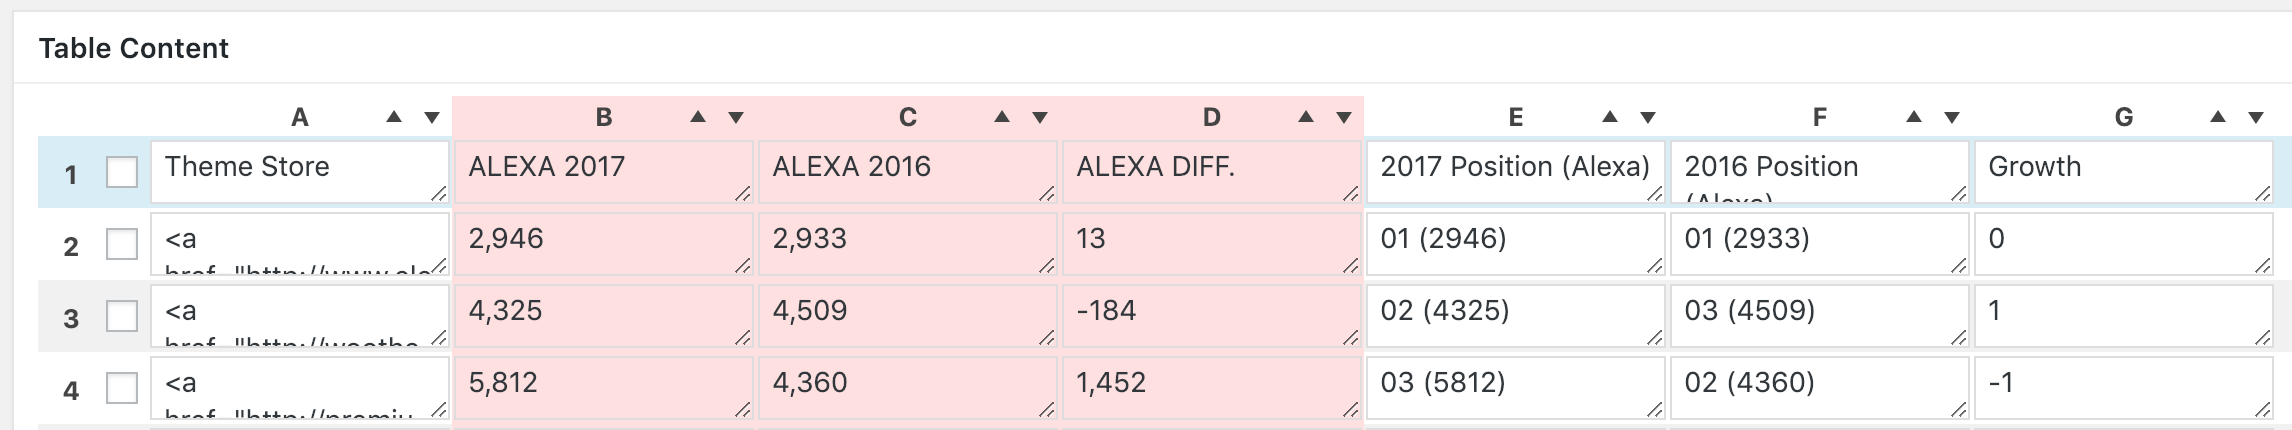
For example, there’s a big table here – listing the top 100 players in the WordPress themes market. Preview:
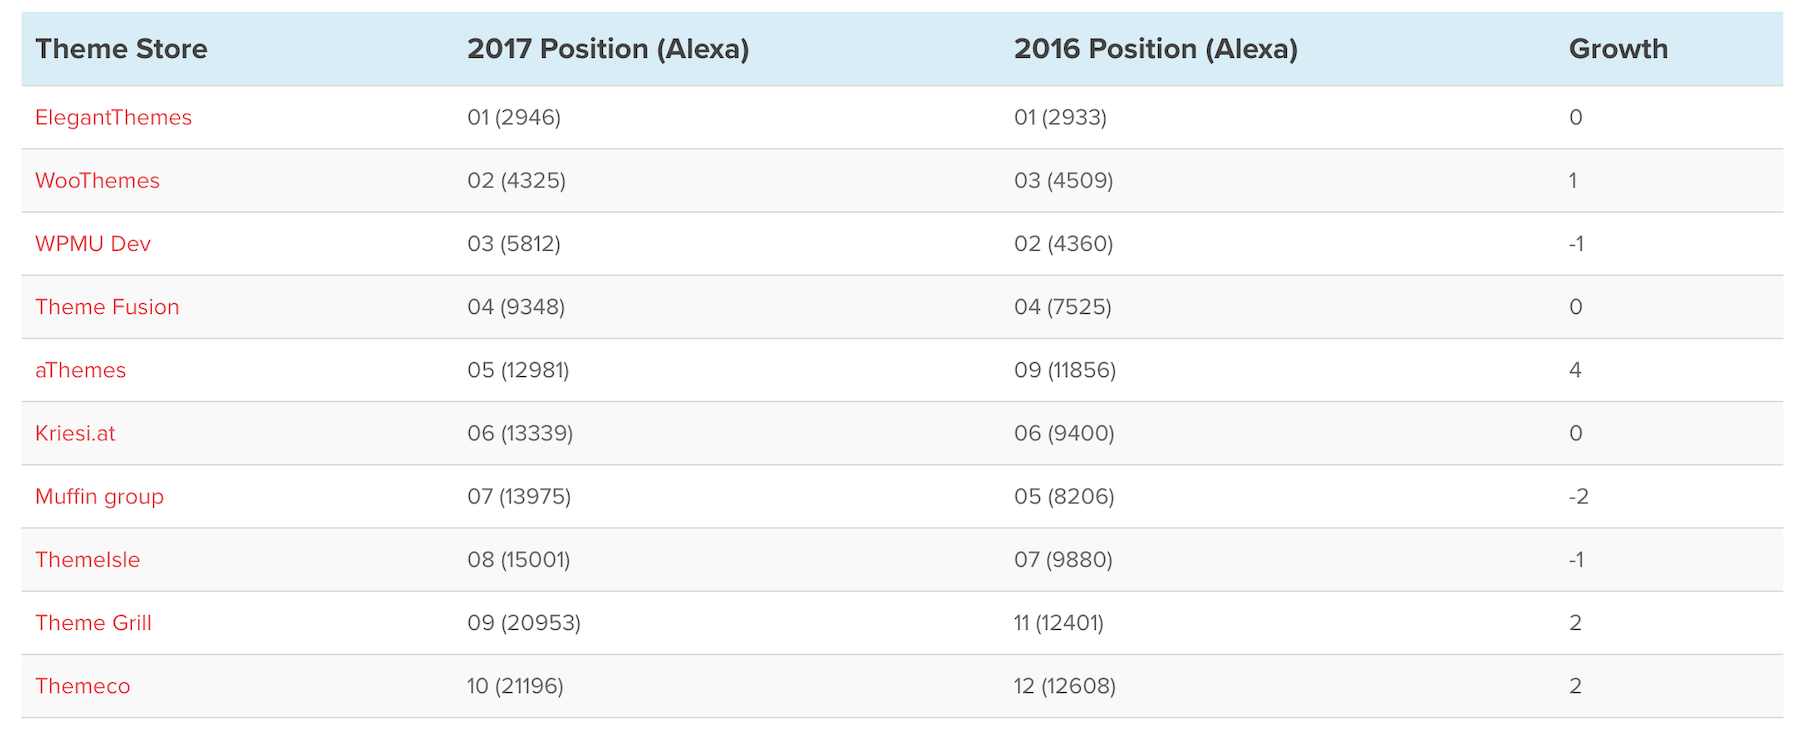

What we like about TablePress is that we can realign the rows easily, hide rows, duplicate rows, and also give the user some controls to sort the table.
For example, for that specific table, we have some more columns in the backend that we don’t display (the red ones). TablePress doesn’t force us to delete them – we can just hide them from display.

Use Shortcodes Ultimate to pimp your HTML tables
Personally, Shortcodes Ultimate (SU) is one of my all-time favorite plugins.
Among its many shortcodes, there’s also one you can use to make your standard HTML tables look a lot nicer.
Here’s a table in our post comparing the top VPN services:
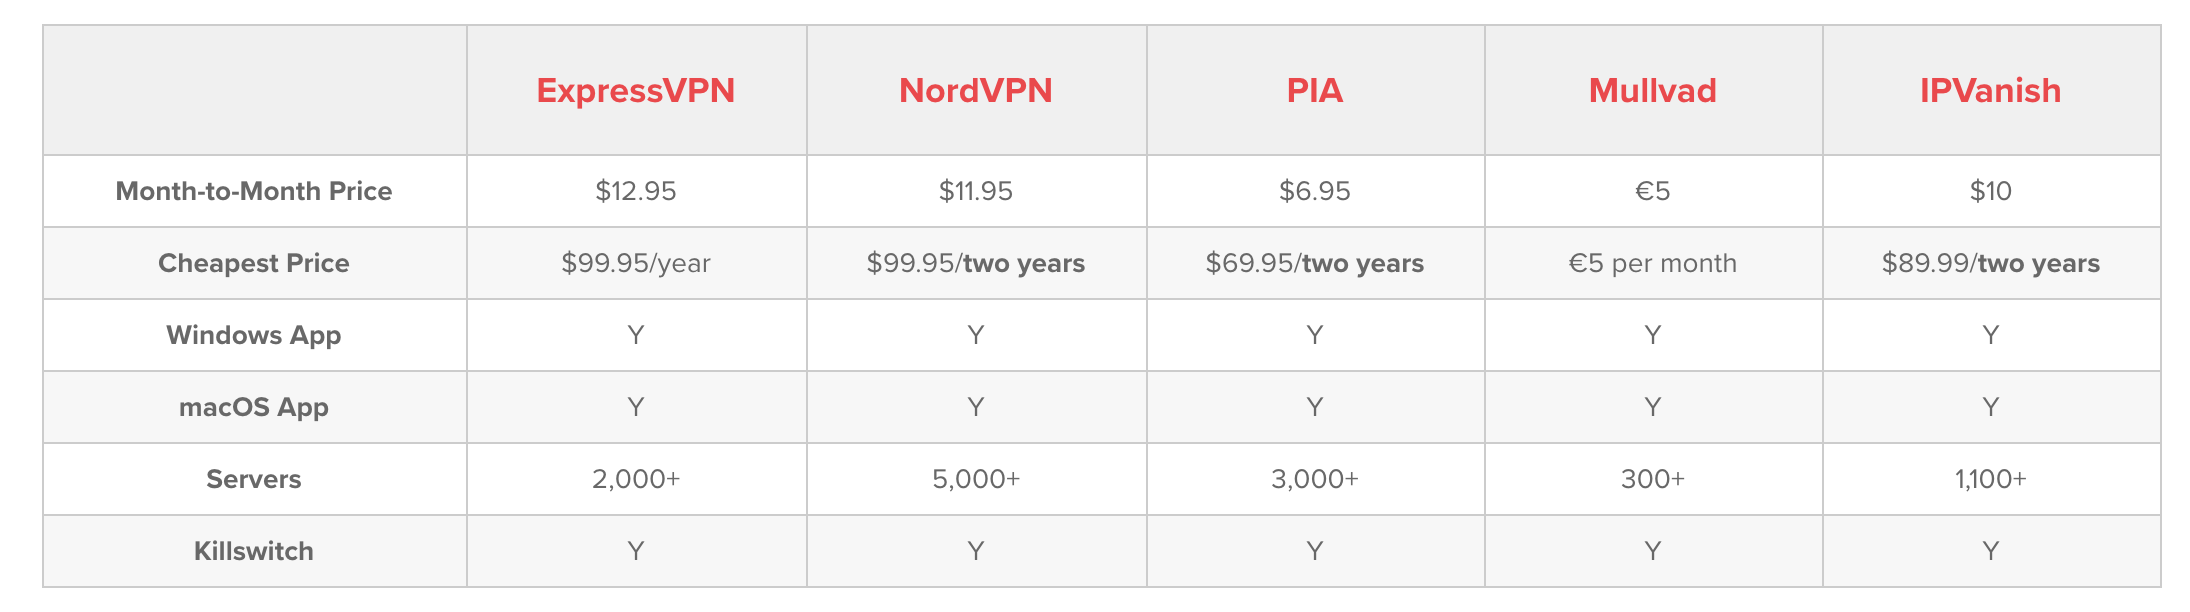

It was built via raw HTML, and then just got an SU shortcode added around it. This one:
[ su_table][ /su_table]
All the row styles and borders you see are SU’s.
In other words, if your theme doesn’t have particularly nice CSS for handling tables, use SU.
? Note; all three of the solutions talked about in this post – Visualizer, TablePress, and SU, can output tables that are ready for mobile and responsive.
Conclusion
I encourage you to experiment with these three plugins. We love Visualizer since it’s our own creation, but we have to admit that the other two are pretty neat as well for specific tasks!