
Device and browser selection
You may wish to test your website from different browsers and devices depending on various circumstances. A good testing tool should allow you to do so.
GTmetrix lets you test your website from a device and browser combination of your choice, which includes mobile phones. However, you need to register for a free account to customize these options.
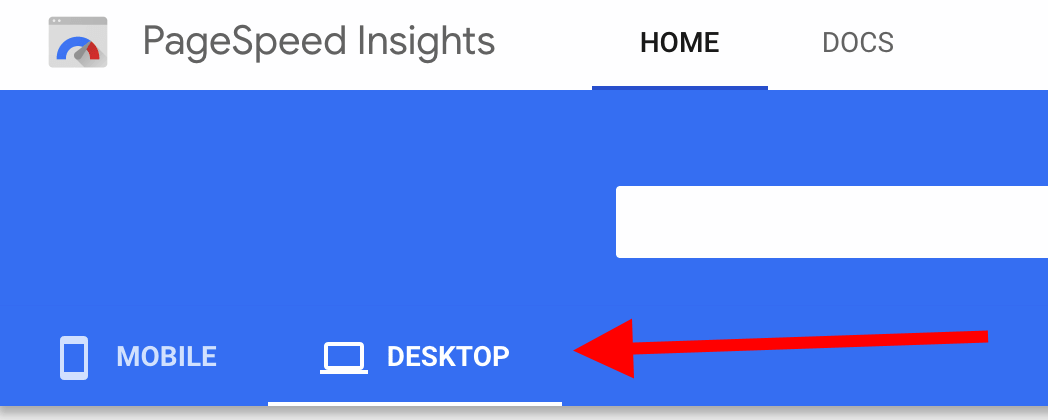
PageSpeed Insights shows you two sets of scores and results – one each for desktop and mobile. However, you do not have much customization ability to select which mobile device to test your website on.

Pingdom Tools does have an option to test your website through mobile devices.
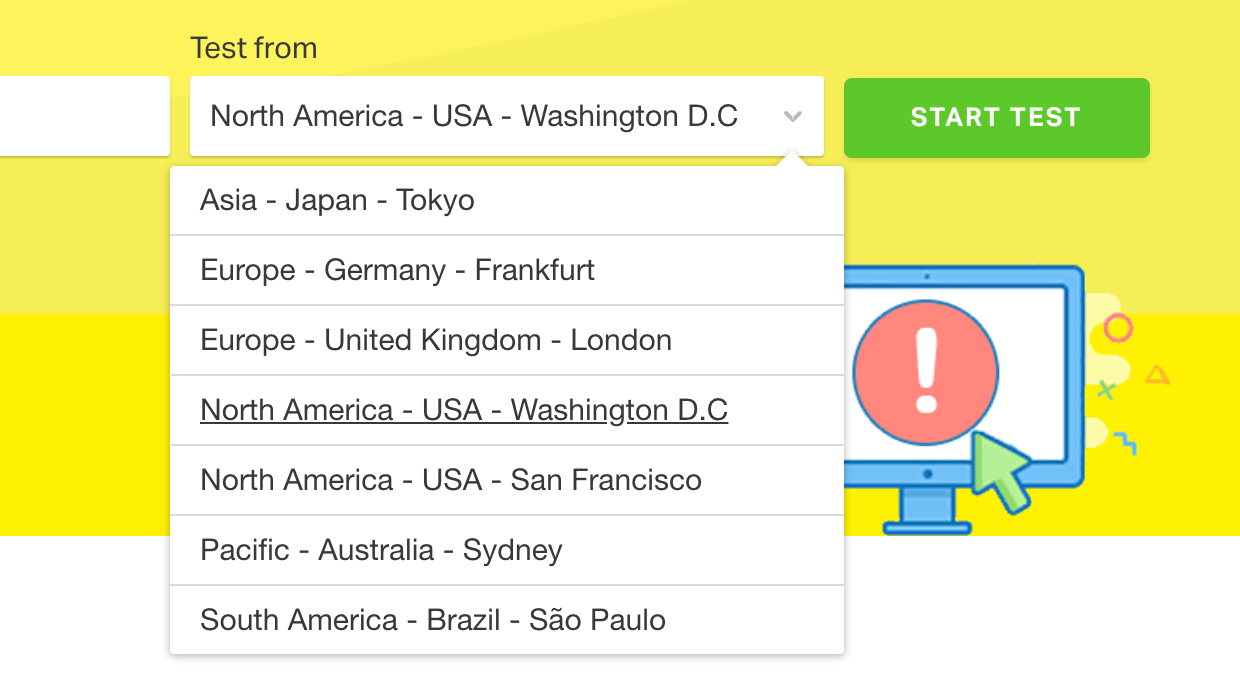
WebPageTest allows you to specify a browser – a device combination too with a large number of available devices for you to choose from.
Test location
The load time of a website also depends on the test location vs the server location. This is because it takes a few (milli)seconds for each request to travel if the user and server are located far away. This small delay may lead to an increase in page load time. If your customers are primarily from one region of the globe, your server should be as close to them as possible.
- GTmetrix allows you to specify the test locations, which cover most major regions in the world. You would need to register to customize this feature.
- PageSpeed Insights does not allow to specify a location, which is most probably internally calculated based on the server location.
- Pingdom Tools and WebPageTest also allow you to select locations. The most variety in the location choice lies with WebPageTest.

Waterfall analysis
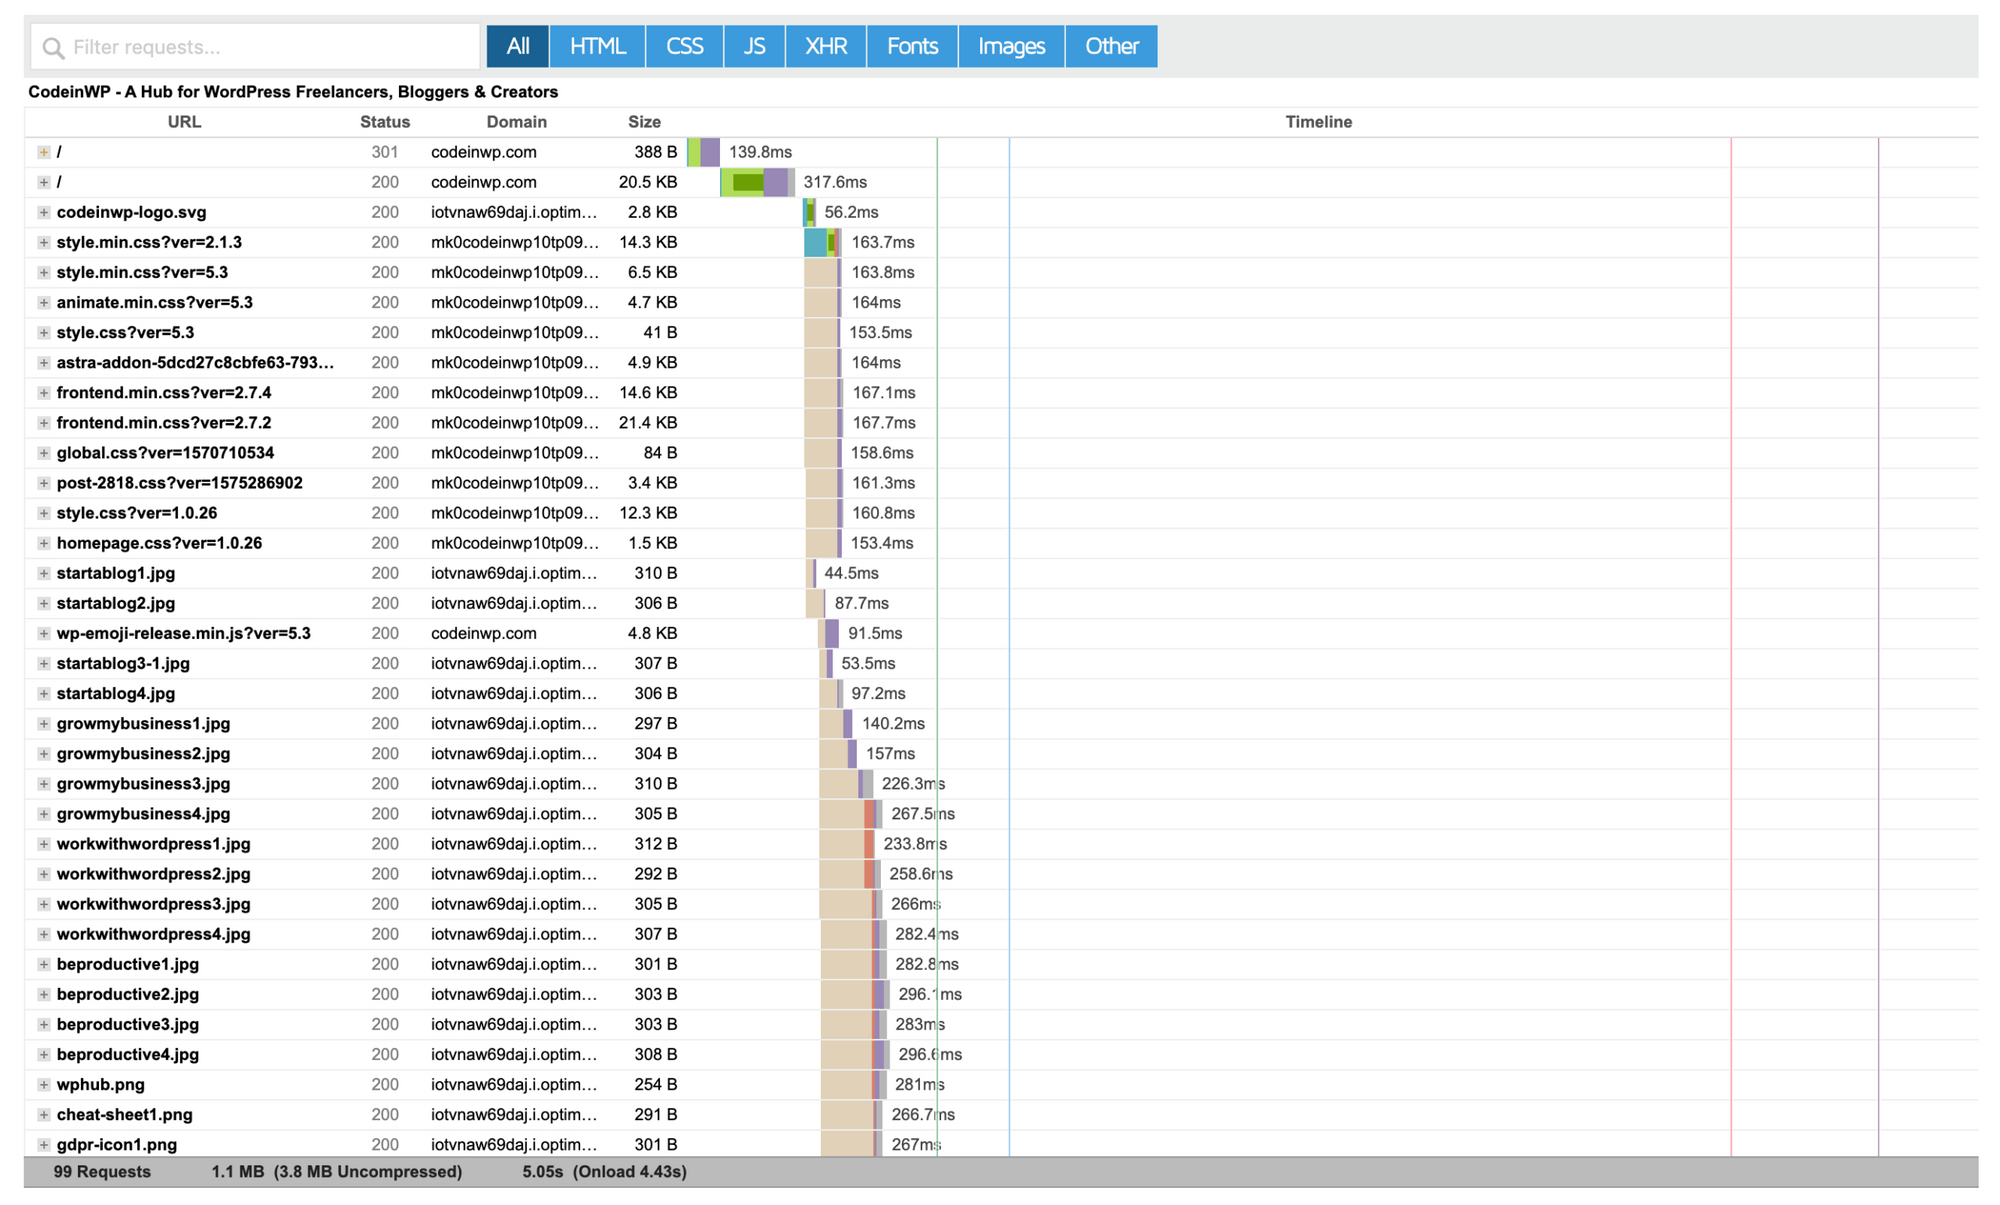
An important feature among these testing tools to carefully analyze bottlenecks in your website design and structure is the waterfall of the page’s loading sequence. During the webpage load, a browser sequentially requests for resources like stylesheets, images and scripts. A waterfall chart visually shows the time each resource takes to load, and how it stands with respect to the overall loading of the page.
GTmetrix, Pingdom Tools and WebPageTest all show you a waterfall chart to deep dive into the resources of your site.

There’s no waterfall with PageSpeed Insights.
Additional features
GTmetrix integrates Google’s PageSpeed Insights and Yahoo’s YSlow rulesets in a test to give you an external perspective of how things work on your website. GTmetrix also allows you to view recorded responses of your tests across devices. If you opt for an account on GTmetrix, you can track performance of pages over time, too. Finally, GTmetrix also gives you the ability to simulate tests with ad blockers enabled, connection throttling, and the use of REST APIs.
Pingdom Tools allows you to monitor and track the uptime of your website, and set alerts for various scenarios.
WebPageTest takes you to the public version of the website, but you can create private instances of WebPageTest with the WebPageTest API. You can also integrate WebPageTest in your CI tool using the API.
Additionally, WebPageTest allows you to write custom scripts to emulate logins into websites before performing a test. Thus, you can test pages in your web application that is behind an authentication layer. However, results of these tests are publicly available, so make sure you use a test account for them. Here is a detailed guide on scripting with WebPageTest.
? Testing a site with GTmetrix vs PageSpeed Insights vs Pingdom Tools vs WebPageTest
GTmetrix
GTmetrix has a collection of features that allow you to scrutinize the performance of a website. It summarizes your results into three metrics: the page load time, total page size, and total number of HTTP requests. The results also show a comparison of these metrics against the average site tested on GTmetrix.

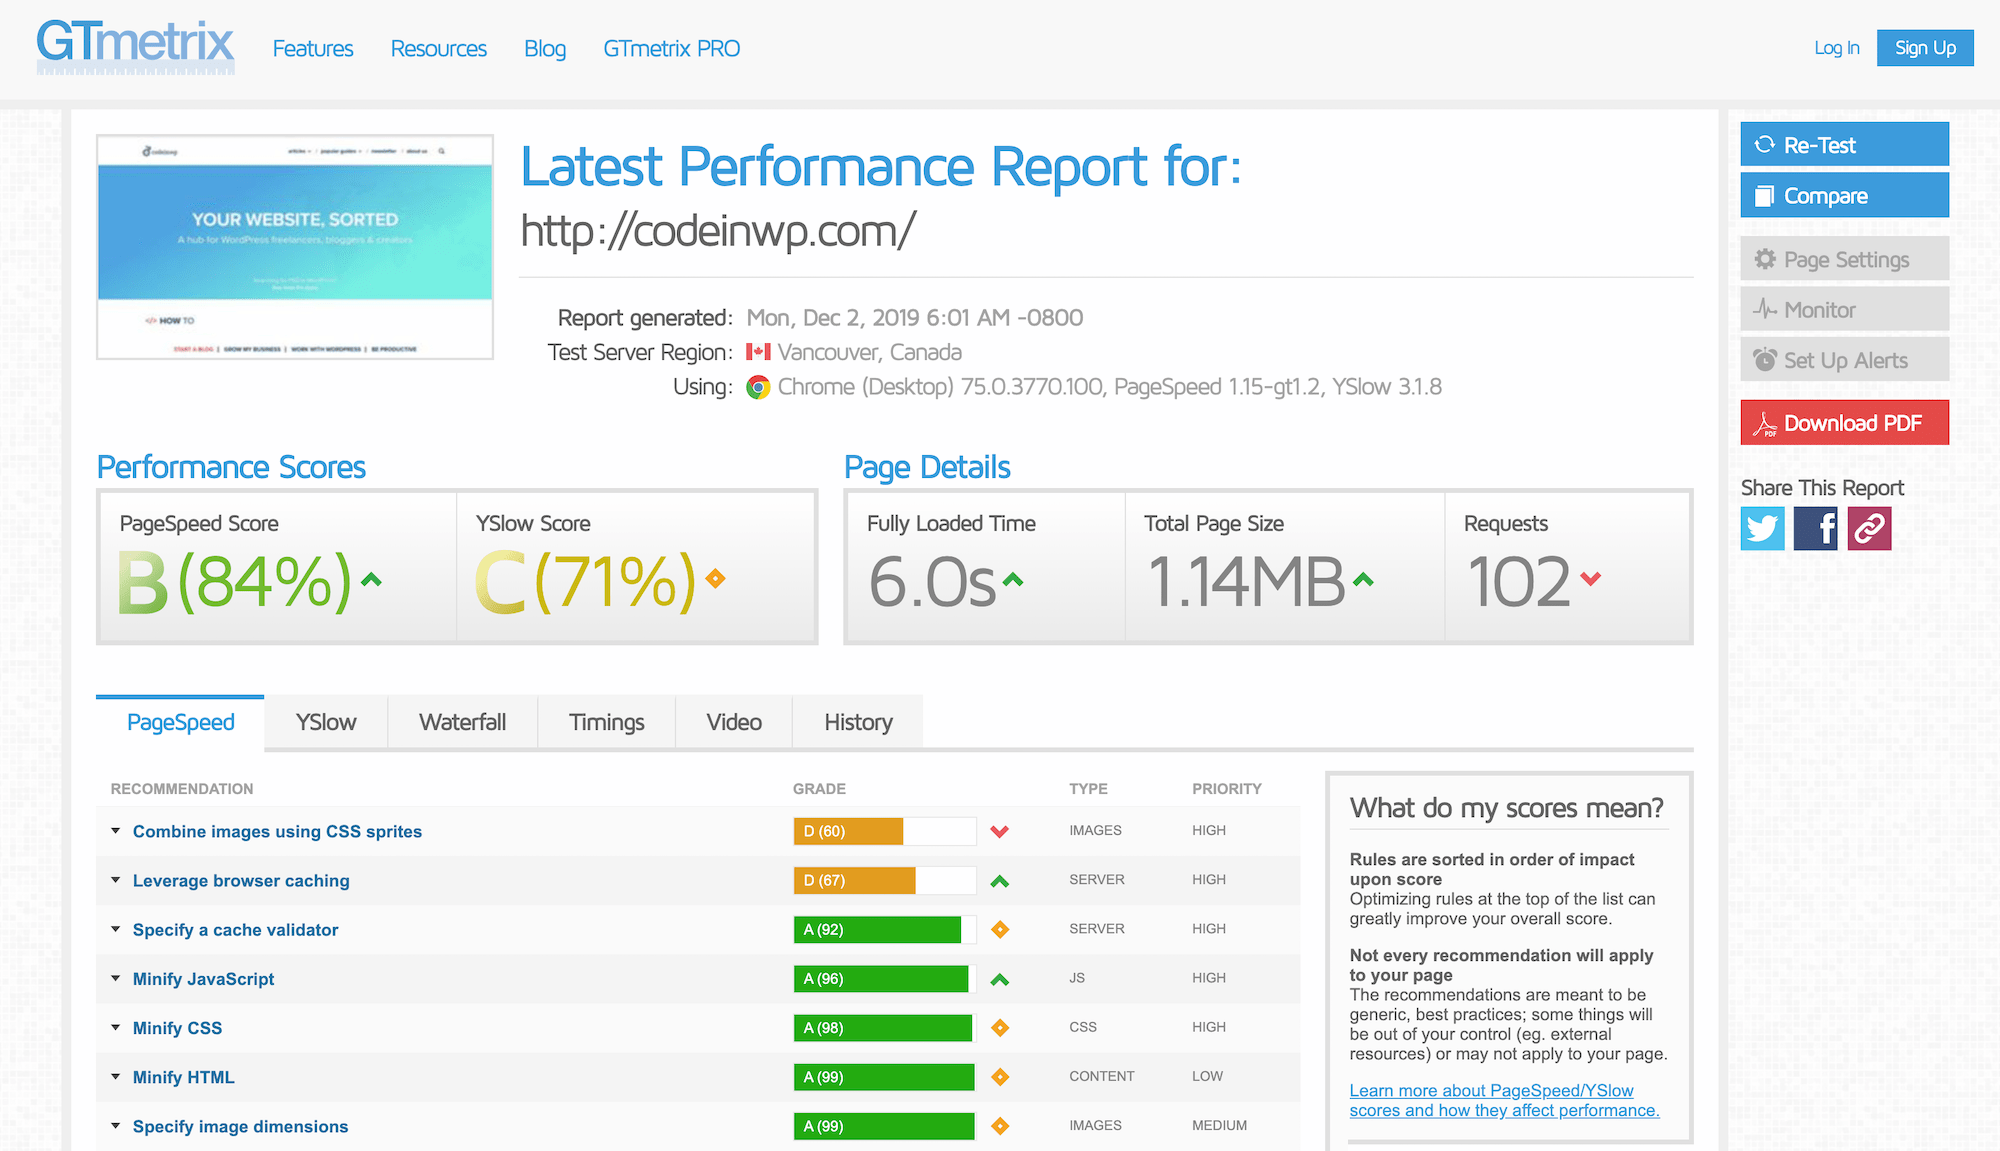
When you perform an ad-hoc test of a website on GTmetrix, you are unable to specify the test location, browser, and connection setting. My test location, for example, defaulted to Vancouver.
The PageSpeed and YSlow tabs show the most critical parameters on which you should evaluate your results. Apart from the number of requests and redirects, the request size and image optimization also play a role in the ranking. Resources such as images and videos should be optimized for the web for quick rendering on browsers. Here is our guide on the how to optimize your website images
? (In the market for an image optimization solution? You might be interested in Optimole.)
Given the HTTP requests seem to affect the scores adversely, you can navigate to the Waterfall tab to analyze how much time was spent on each request as the page was loaded. This would allow you to find requests that create bottlenecks in the page load process. Videos and graphs are available once you create an account on GTmetrix and perform multiple tests over.
PageSpeed Insights
PageSpeed Insights shows you two main tabs – for mobile and desktop.

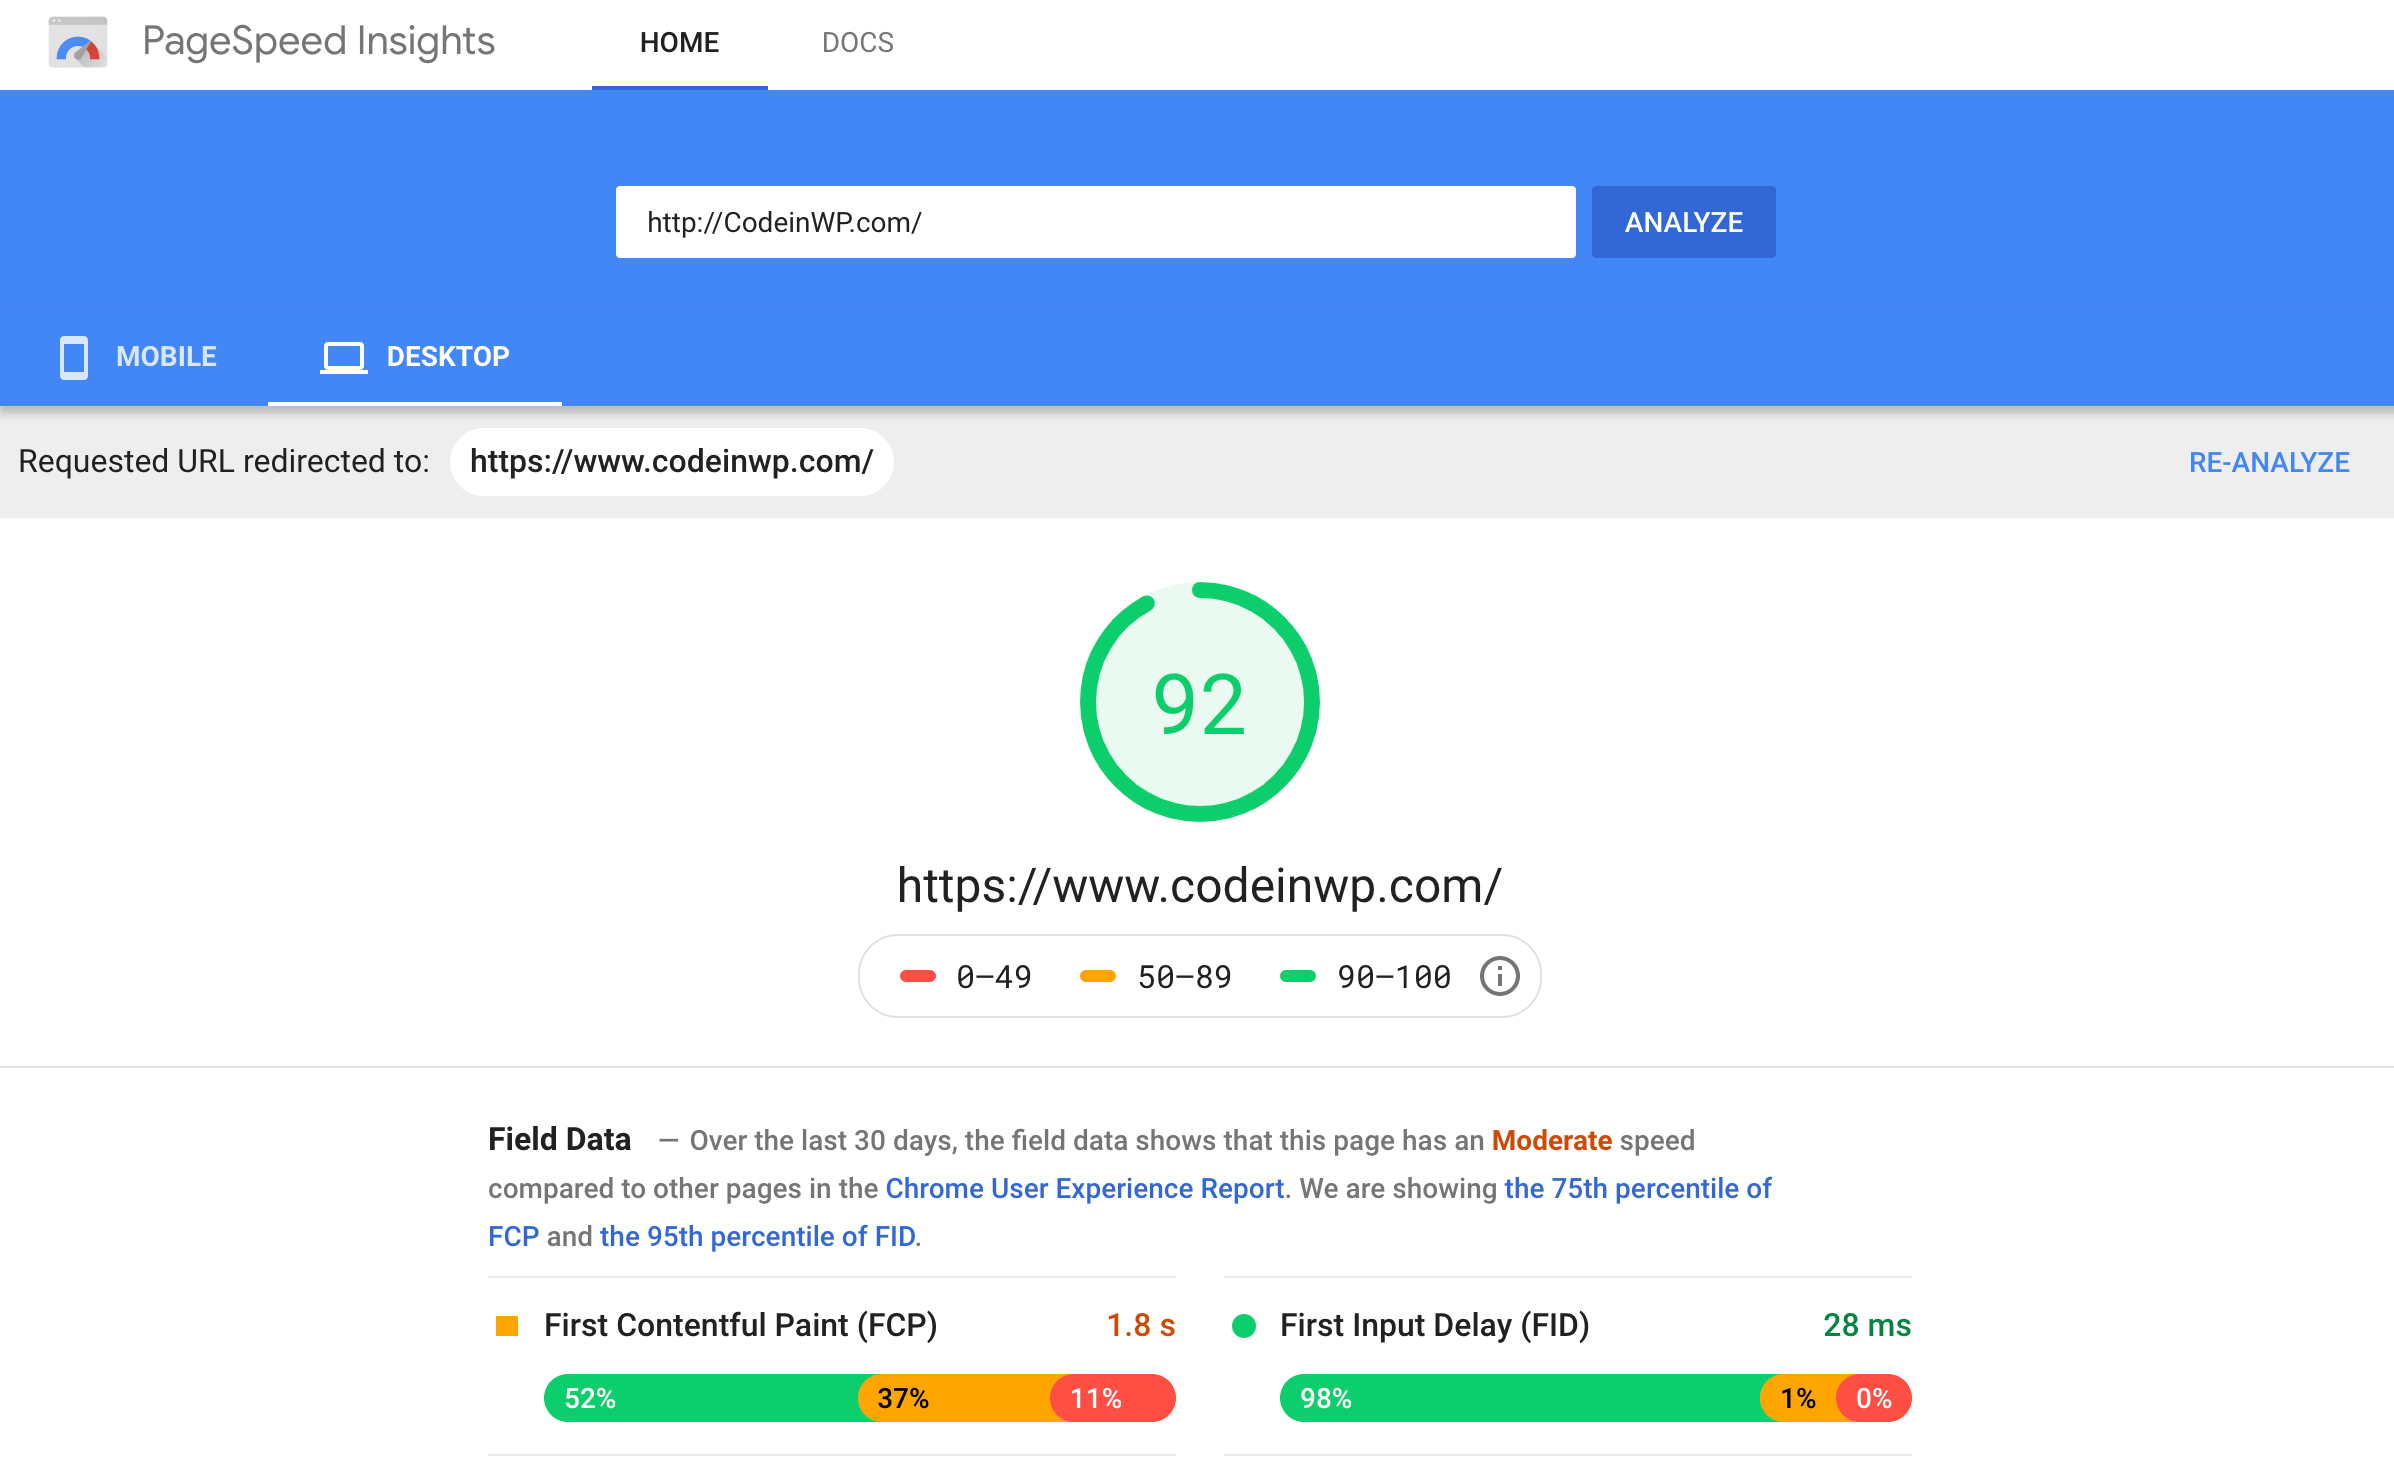
The tool also does a good job in providing you specific action items to improve your score.

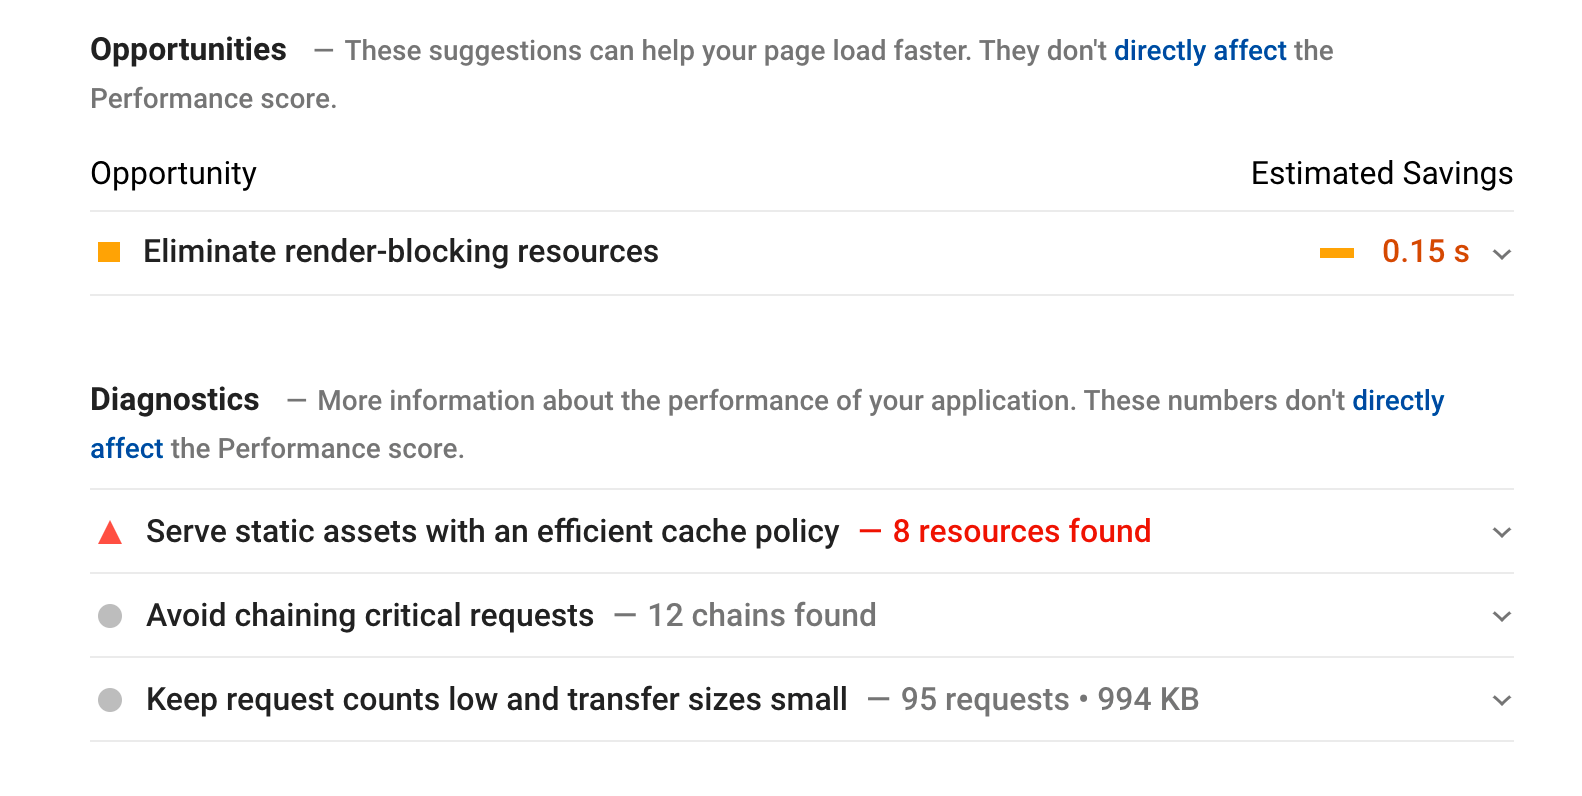
When doing your tests with PageSpeed Insights, you’ll get a range of different tips and analysis on what’s potentially problematic about your site. PageSpeed Insights can identify high numbers of third party requests, lack of caching policy, or excessive DOM structures.
Though the action items provided by the tool are good, it leaves little room for customization. You are unable to specify common parameters such as connection throttling and server location. Further, these parameters are not reported by the tool as well.
Since PageSpeed Insights is provided as a standalone tool, you are unable to create an account and track test results over time, leaving the only option of manually running each test.
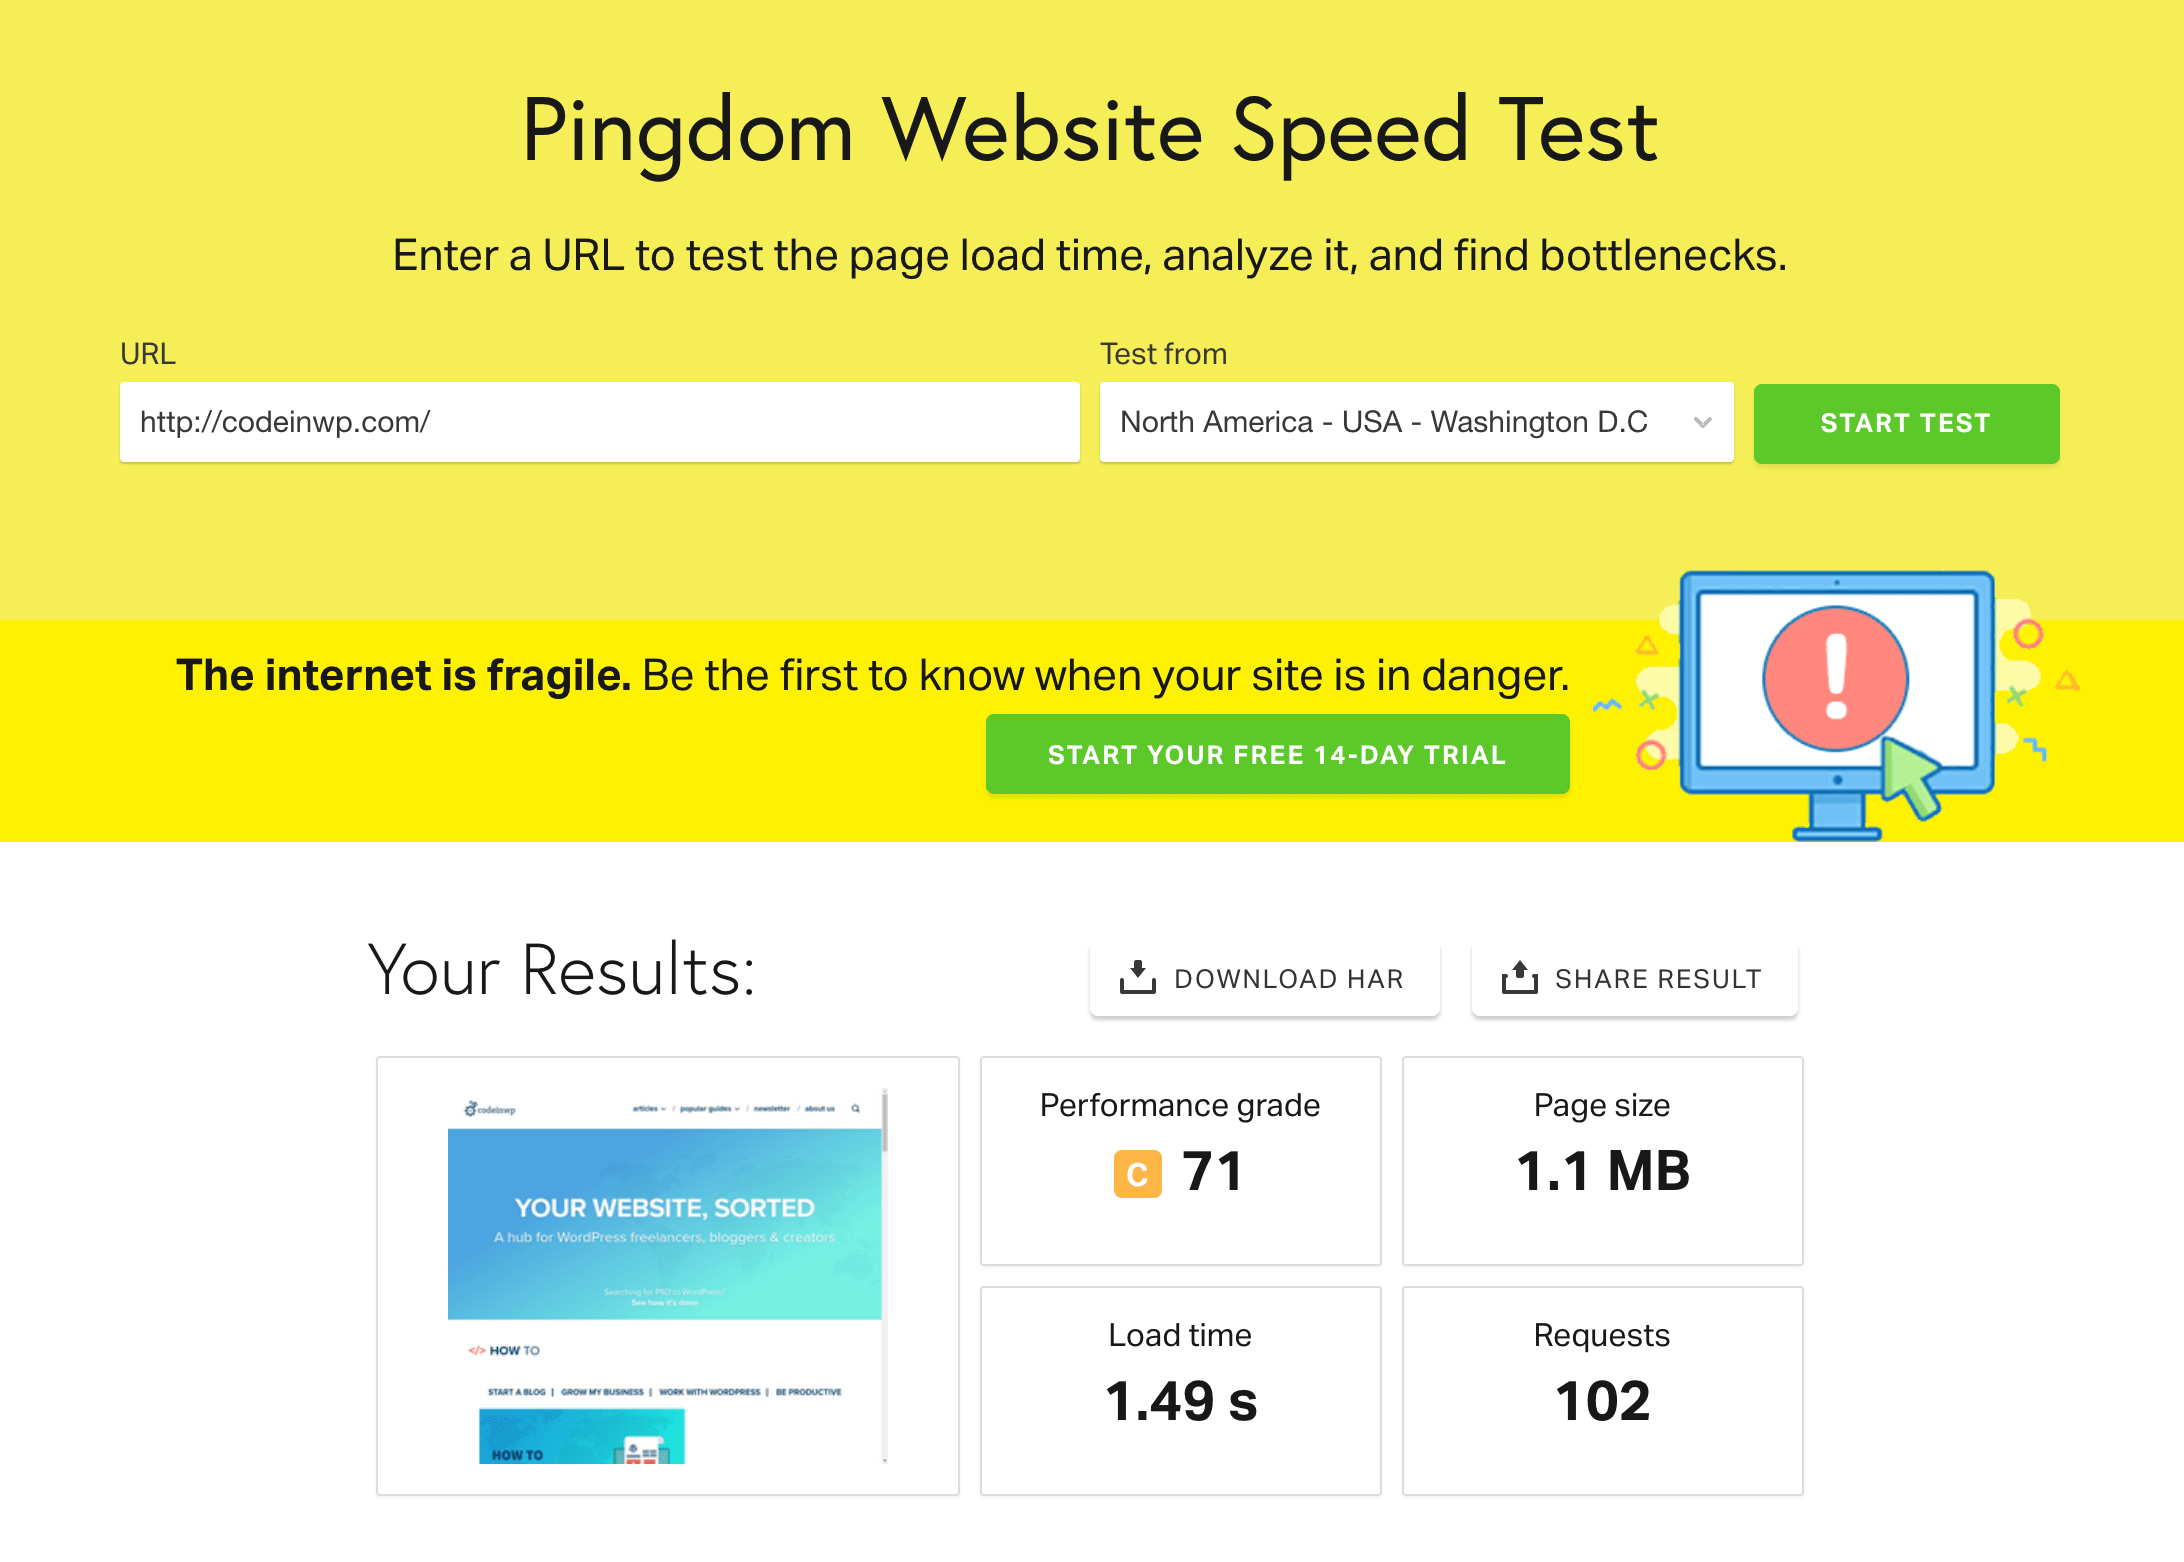
Pingdom Tools
To start a one-off test on Pingdom Tools, enter an URL and specify a location for the test server – you are given one or two choices from each continent. Once the test is complete, the results are available for your review.

The next sections of the results show the primary areas of concern for the website. Some common features from earlier tests are highlighted here too.

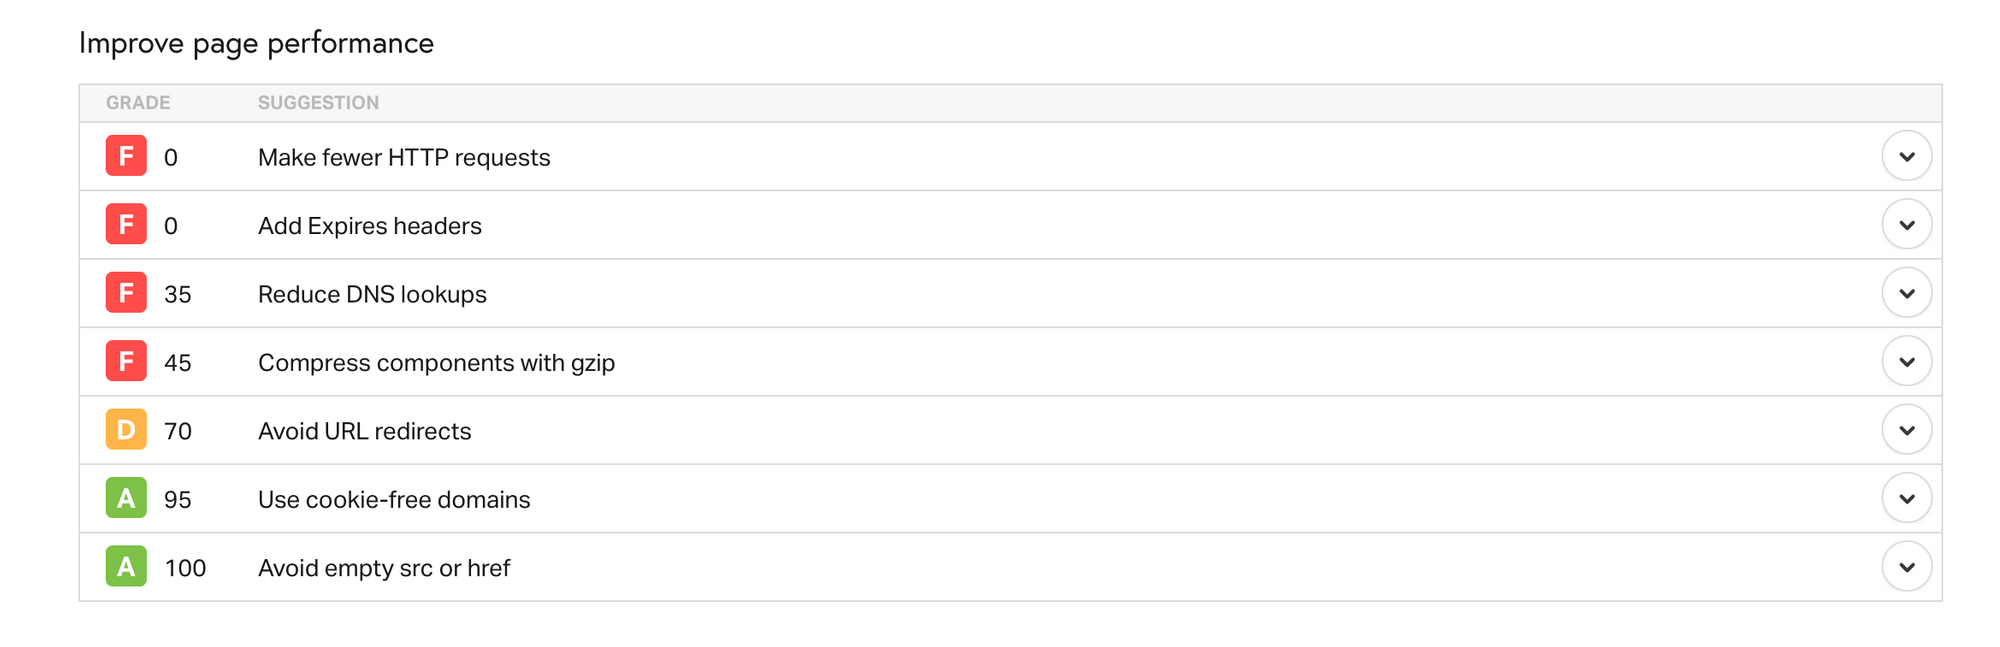
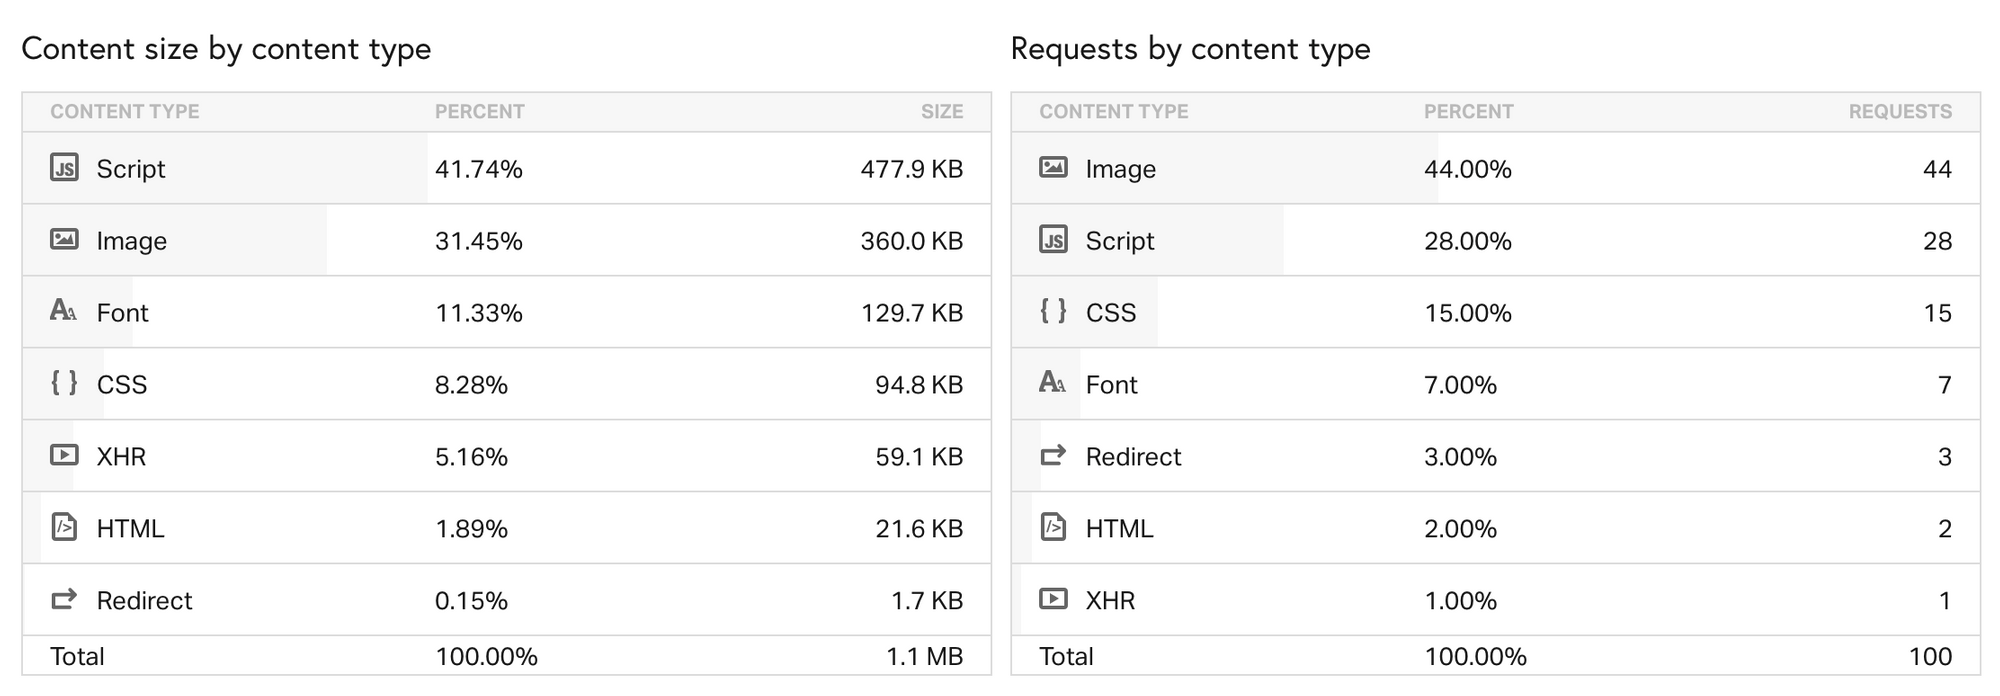
One of the more useful blocks that Pingdom Tools features on the page come under “Content size by content type” and “Requests by content type.” These allow you to further explore what type and source of content has the most impact on your results. In my example, images add up to nearly half of the page size.

In the final section, Pingdom shows you the list of requests on the page, similar to the waterfall tab in GTmetrix. You can interactively analyze which resources took the most time to load.
WebPageTest
In a simple test, all of the advanced settings are run at their default values.

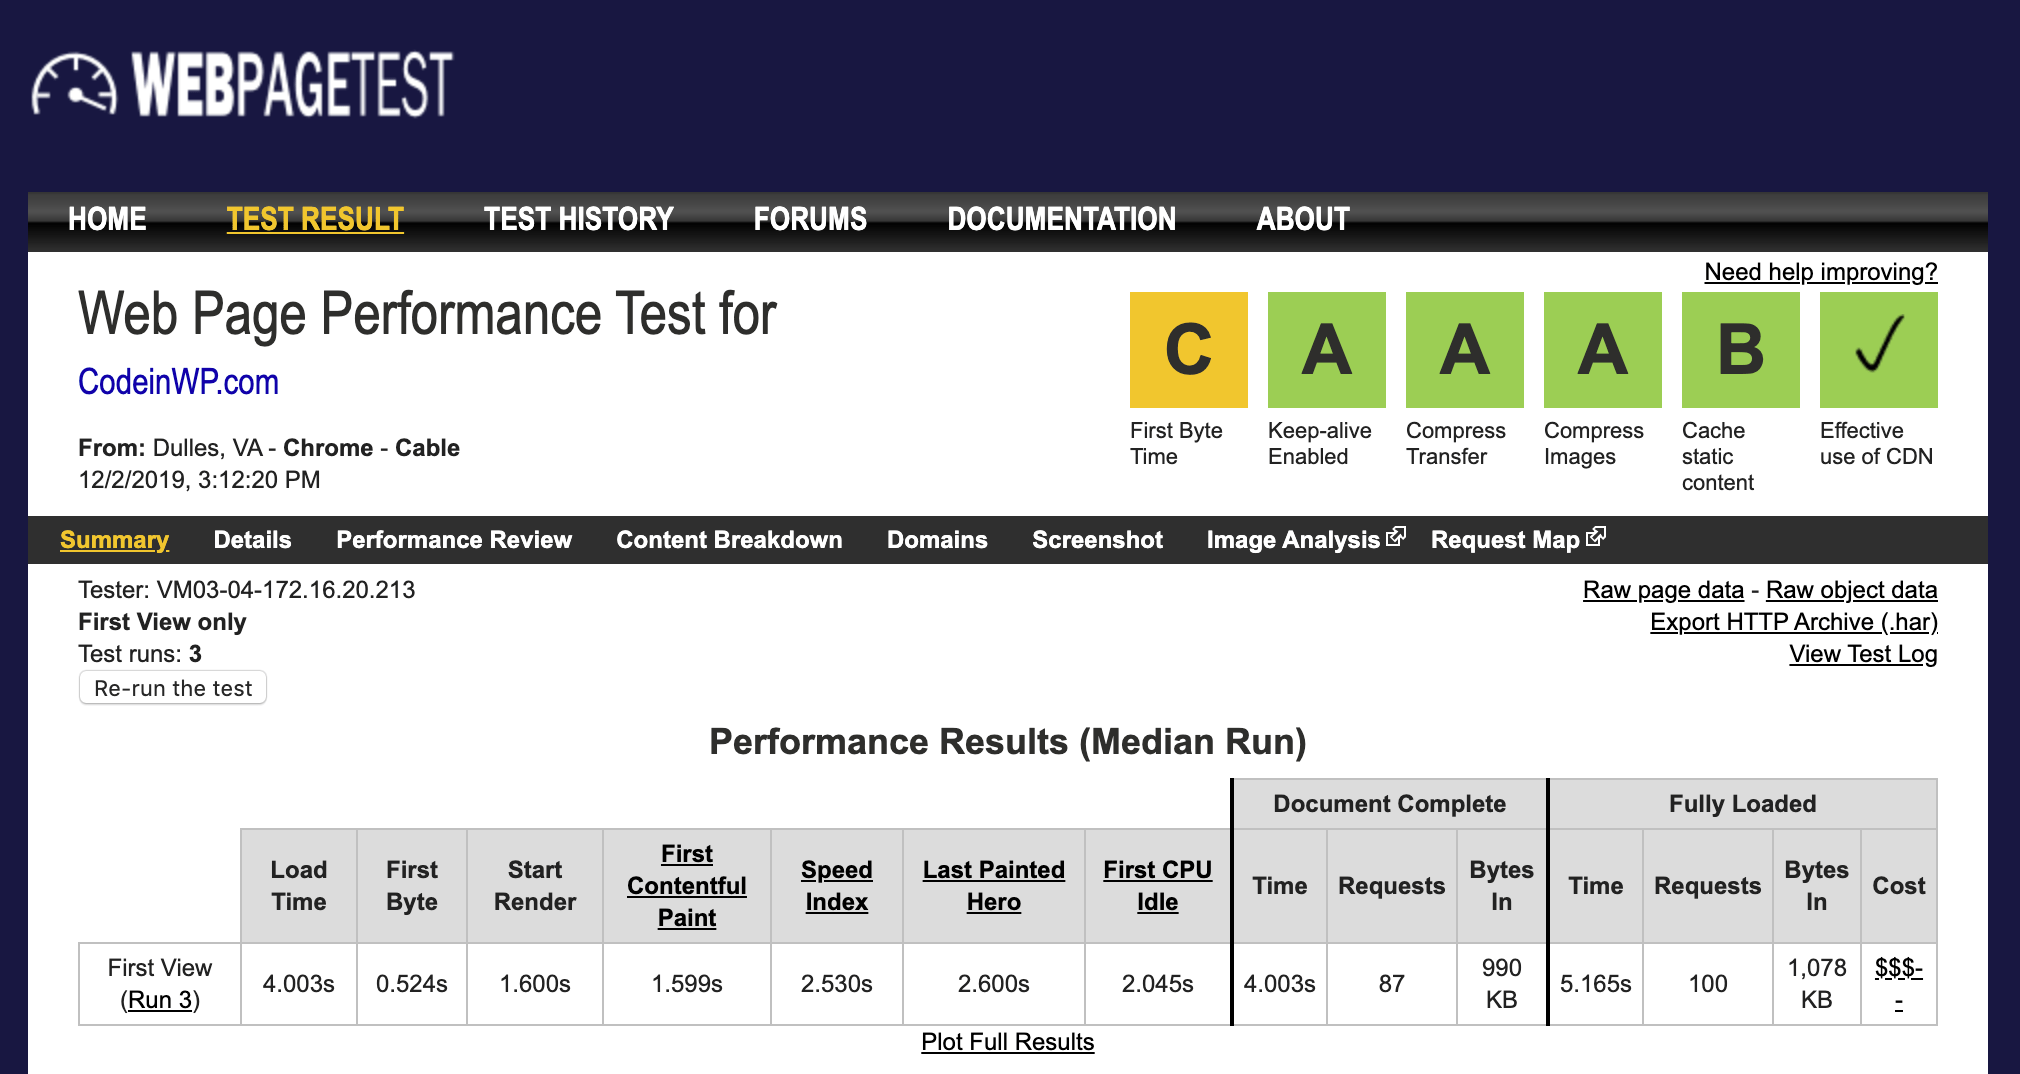
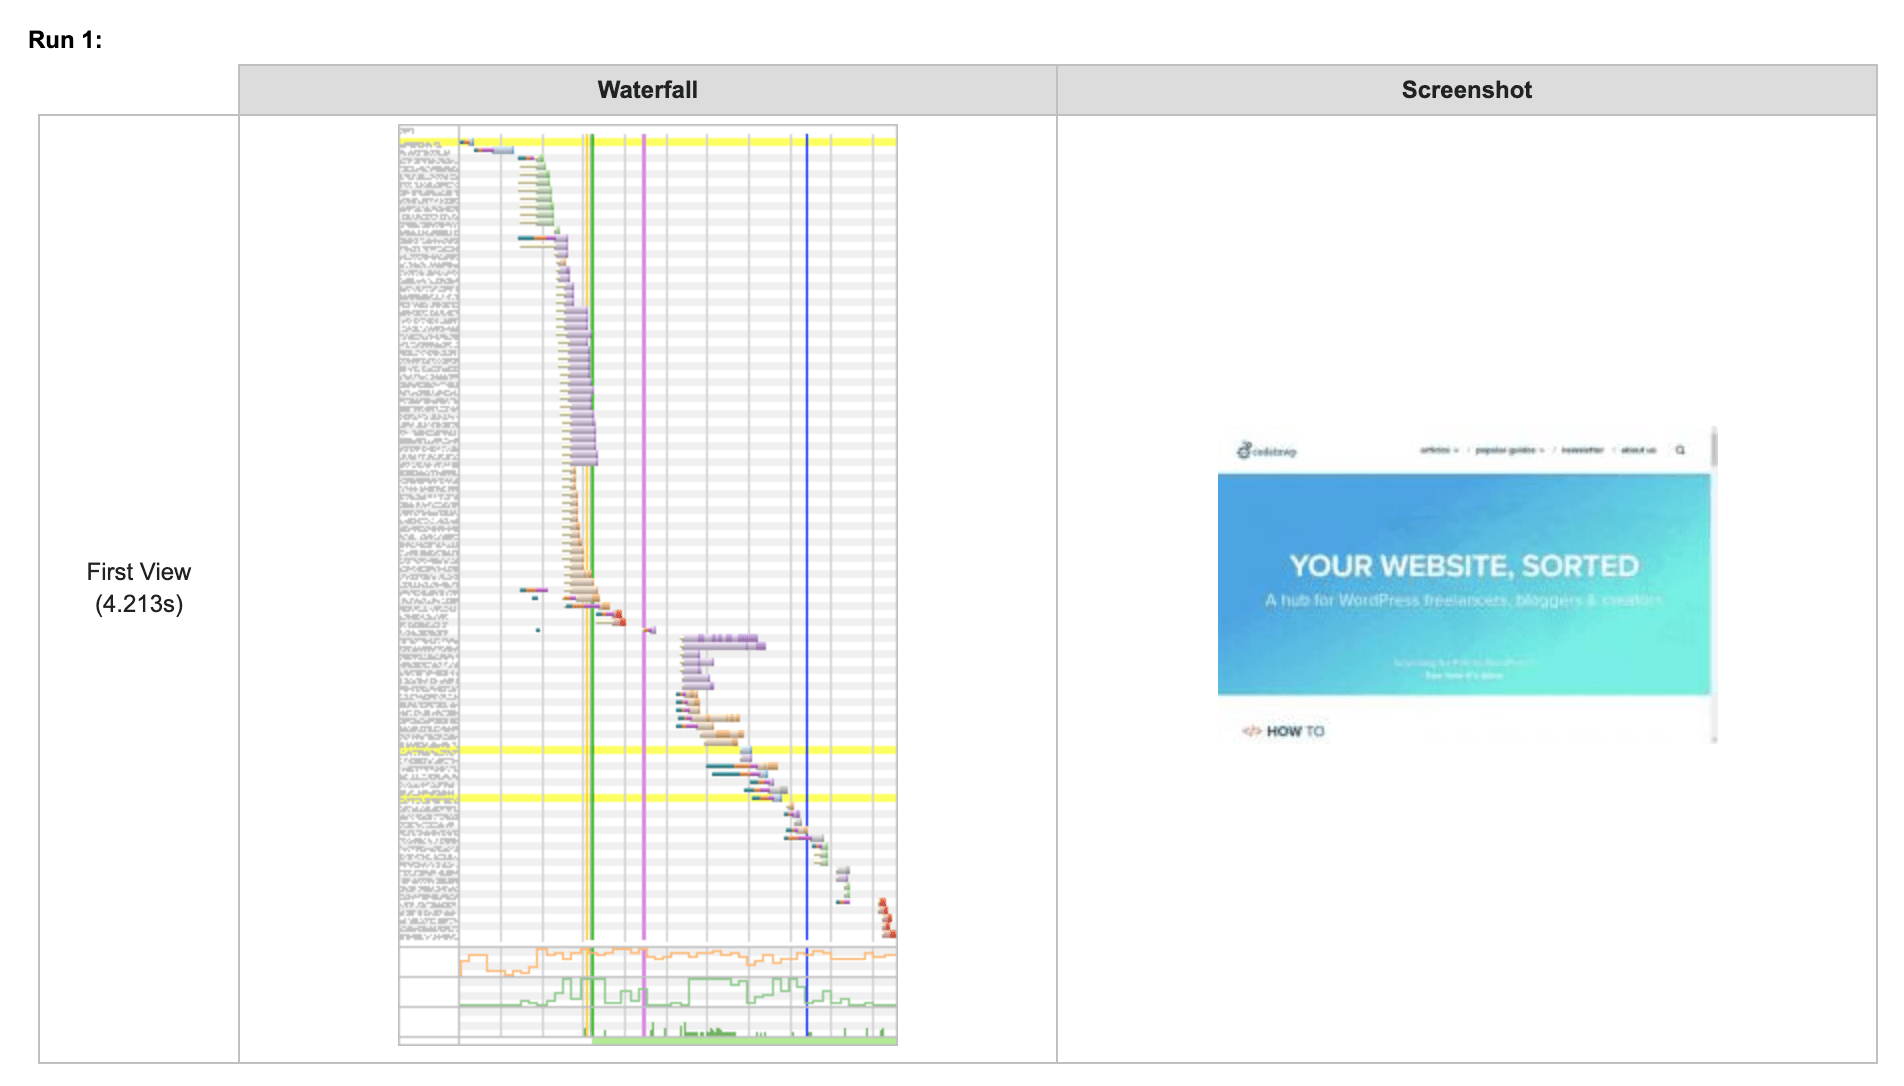
The tool performed three tests, and the results show the median statistics. The summary lists down the metrics of the run. You can also see a compressed waterfall of requests. Further, a screenshot of the loaded website is present along with options to view a filmstrip view and a video of the test. The detailed tab shows the waterfall with more details and metrics of each run.

The performance review tab shows the full optimization checklist of the website. It lists down all resources and stacks them against parameters that affect the performance of the website. The content breakdown, domain and processing tabs show you the distribution of the content and requests on the page. These tabs are of use when you need to dig deeper to find a solution to a given issue. Image Analysis and Request Maps redirect you to other services.
WebPageTest also enables you to create custom metrics to assess your website on. You can either specify a custom metric during a test, or append a static JavaScript file, if you are running a private instance.
WebPageTest provides the most customization options among the tools discussed in this post. The simple testing tab allows you to enter the URLs of the websites that need to be tested, along with test configurations. You are also given an option of performing a Lighthouse audit.
? How to choose between GTmetrix vs PageSpeed Insights vs Pingdom Tools vs WebPageTest
In this post, we looked at GTmetrix vs PageSpeed Insights vs Pingdom Tools vs WebPageTest to decide which tool is the best for various performance testing of your websites.
To begin with, performing a test on all of these tools is free. Pingdom Tools and GTmetrix also offer a paid, premium suite of tools, in addition to the ad-hoc tests. PageSpeed Insights and WebPageTest don’t have any premium plans.
In conclusion, I’d recommend the following:
- If you need a tool to do simple tests with, give Pingdom Tools a try. It will show you everything you need to know to get an idea of how fast a website is. ? BEST OVERALL
- If you want detailed test results and track them over time, you should go ahead with GTmetrix.
- For actionable insights that affect SEO directly, you should use Google’s PageSpeed Insights. ? BEST FOR SEO
- To go a bit more granular into how your test works and what you want to test specifically (like in a development scenario, for example), then go ahead and check out WebPageTest.
Which among GTmetrix vs PageSpeed Insights vs Pingdom Tools vs WebPageTest is your favorite? Do let us know in the comments below.