Every business must pay close attention to their numbers and performance metrics at all times. One way to do that is to get on board with some of the best business intelligence tools available on the market. These platforms help collect data (from different data sources), prepare and analyze it, create good-looking visualizations, and then share reports instantly.
The main benefit of all that isn’t the fact of gathering data in itself, but rather having the tools to identify patterns and predict trends that can create a competitive advantage for you. This can be crucial for your business’s ability to stay on top of trends and ahead of the competition.
Luckily, there are quite a few contenders to be considered the best business intelligence tools. They vary in pricing, capabilities, integration possibilities, and ease of use. At the very least, they should help you to connect with your data, collect every piece of insight in one place, and then help you analyze results in a live-feedback loop.

Broadly speaking, the best business intelligence tools should offer you the following features:
- Connecting with all data sources that relate to your business’s performance.
- Bringing all your data together in one place.
- Automating data pipelines.
- Interactive dashboards and visualizations.
- Offering different tiers of user access.
- Supporting cloud-based or on-premises storage of data.
- Offering analytics to drive insight-based actions.
- Real-time alerts and push notifications.
- Connecting with applications and integrating with other business tools.
Best business intelligence tools in 2021
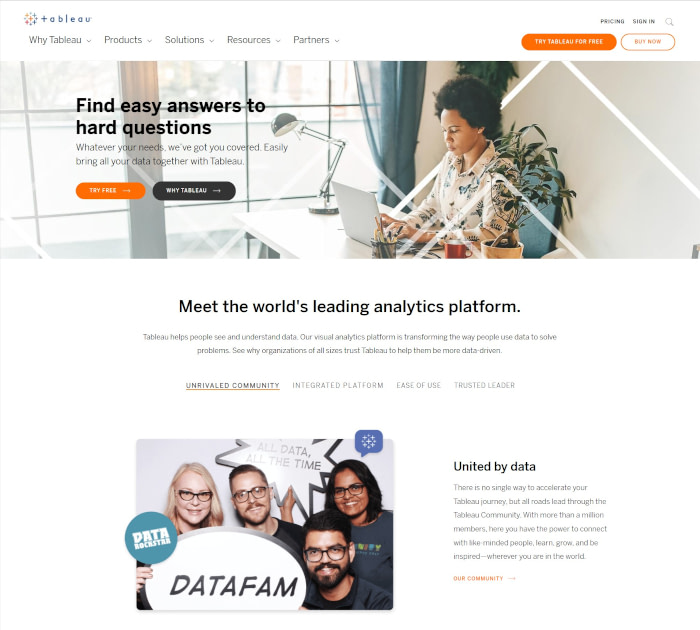
Tableau
? Pricing:
Rates vary for Teams, Individuals, Embedded analytics, as well as for online deployment/server deployment with Tableau. Basic Tableau Viewer costs $15/user/mo, billed annually. Explorer and Creator cost $42 and $70 respectively.
? Key features:
- Helps users to prepare date and interact with it. Users can interact with data and collaborate in teams.
- Intuitive drag-and-drop products, no programming.
- Combine multiple views for better insight.
- Explore any data from spredsheets to databases to cloud services.
- Publish and share a dashboard with a few clicks.
- Curate and share data sources.
- Interact with visualizations and dashboards.
- Set and see data quality warnings.
- Advanced server deployment monitoring.
- Million+ members in the Tableau community.
? Pricing:
Four packages are available Basic ($30 for two users), Standard ($60 for five users), Premium ($145 for 15 users) and Enterprise ($575 for 50 users) for cloud deployment. Rates differ for on-premise deployment. A 15-day free trial is available.
? Key features:
- Data preparation, management and integration.
- Visual analysis and augmented analysis.
- Automatically identify data types and get suggestions for joining datasets.
- Drag-and-drop report creation.
- Beautiful dashboards, including geo-visualizations.
- Teams with technologies like AI and ML to augment analysis.
- What-if analysis and predictive analysis.
- Pre-built analysis and Unified Business Insights.
- Lets users search for trends using natural language.
- Trusted by 13,000+ customers and two million+ users.
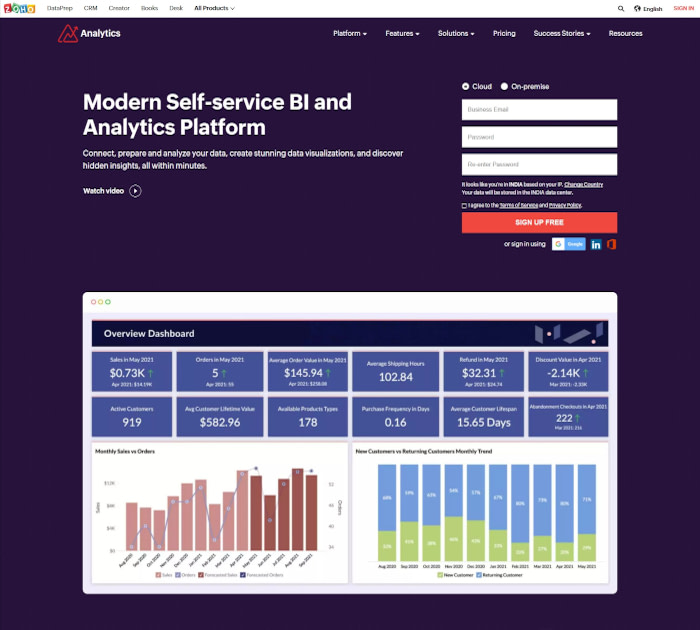
? Pricing:
Free trial is available, and pricing is dependent on data storage, data refresh rates, volume of data queries, number of users and more. A Standard Plan is estimated to cost about $83/user/mo, while the Professional Plan is likely to cost about $190/user/mo.
? Key features:
- Connects any data source.
- Build custom apps and automate data pipelines.
- Share analytic content with partners to commercialize data.
- Embedded analytics to share outside your organization.
- 150+ interactive chart types.
- Real time alerts and push notifications.
- Instant collaboration with chat.
- Define and manage customized user access.
- Scheduled reports, unlimited card sharing.
- Natural language queries.
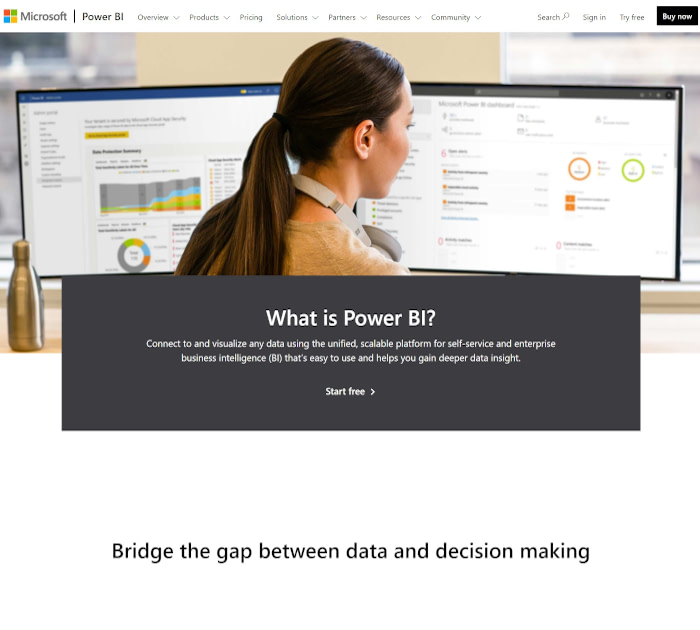
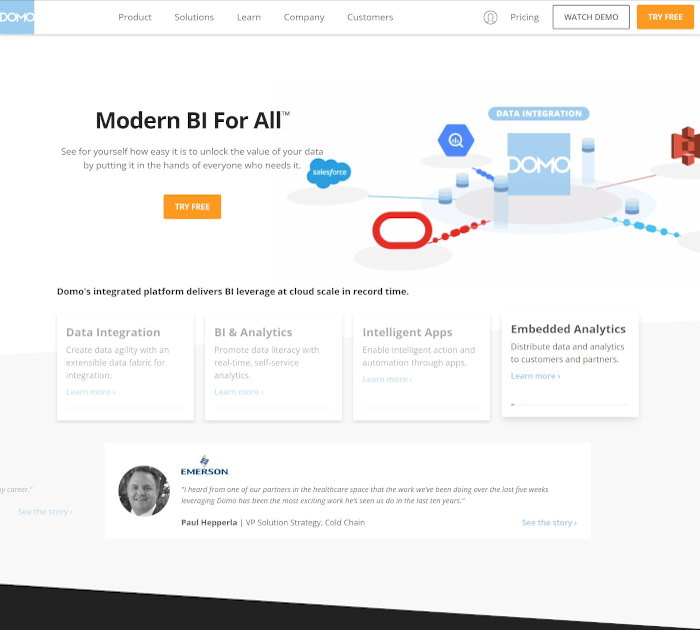
? Pricing:
Beyond the free trial, the Pro license costs $9.99/user/mo. Premium Power BI for individuals comes at $20/user/mo and for organizations at $4,995/capacity/mo. Plans have a model size of 1GB/100GB and 400GB respectively.
? Key features:
- Connects to 100+ data sources.
- Create reports and visualizations.
- Advanced AI that includes text analytics, image detection and ML.
- Multiple dataflows.
- Data security and encryption.
- Application lifecycle management.
- Metrics for content creation, consumption and publishing.
- Autoscale add-on availability.
- Paginated reports.
- Easy report sharing and collaboration.
You may also be interested in:
Sisense
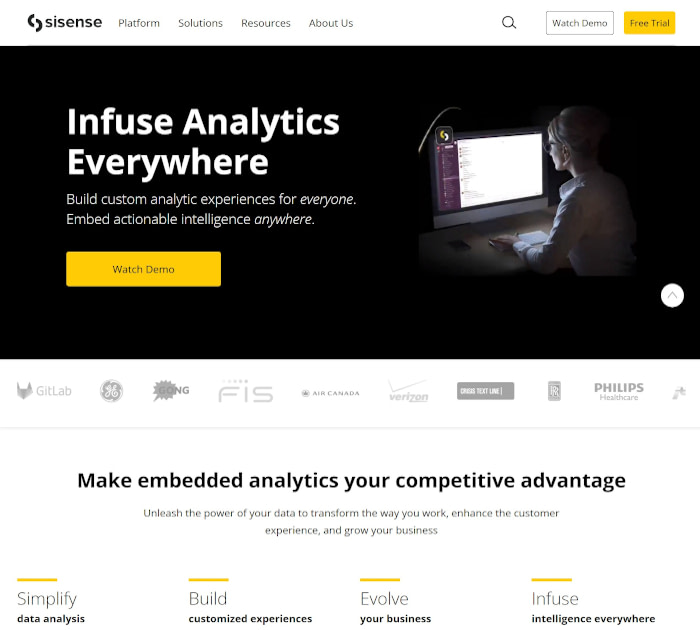
? Pricing:
Sisense offers personalized quotes based on number of users, data volume, job/project type and project timeline.
? Key features:
- Embedded analytics for competitive advantage.
- Cloud or on premises data.
- Automate multi-step operations to accelerate workflows.
- Integrate AI-powered analytics into workflows, processes, applications and products.
- Interactive browser-based dashboards.
- Identifies and filters critical metrics.
- Connects with multiple data sources and formats.
- Build complex data models in a visual environment.
- Integrates with external websites and web applications.
- 2,000+ reputed companies in customer base.
? Pricing:
Requires a perpetual license. Pay for only the functionality and users you need. Some estimates put it at $14,000/year for ten users.
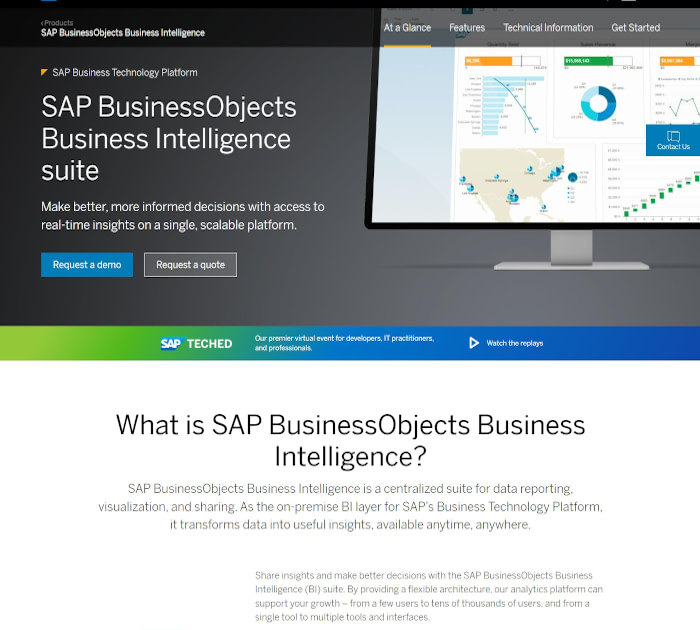
? Key features:
- Centralized suite for data reporting, visualization and sharing.
- Flexible architecture supports few users or up to tens of thousands of users.
- On-premise deployment.
- Real time business intelligence.
- Increased user autonomy.
- Simplified, personalized and dynamic information consumption.
- Ad-hoc reporting and sharing.
- Self-service features, cross-enterprise sharing.
- Role based dashboards.
- Embedded analytics in Microsoft PowerPoint.
? Pricing:
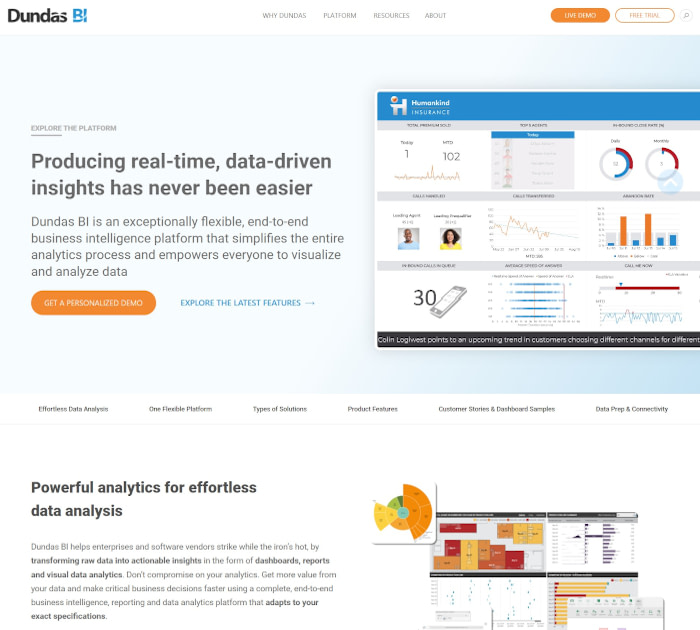
Dundas adopts a custom pricing model with all features included. You’ll not need to pay for additional modules or for maintenance and upgrades.
? Key features:
- Flexible end-to-end business intelligence tool with limitless customization.
- Visually interact with personalized dashboards and reports.
- Data-driven notifications.
- Engaging and rich data visualizations
- Connect to any data source in real time.
- Combine real-time data with historical data in the same dashboard or report.
- Tailored data discovery process.
- Predictive and advanced data analytics in a highly personalized format.
- Immersive mobile experience.
- Open, fully programmable platform.
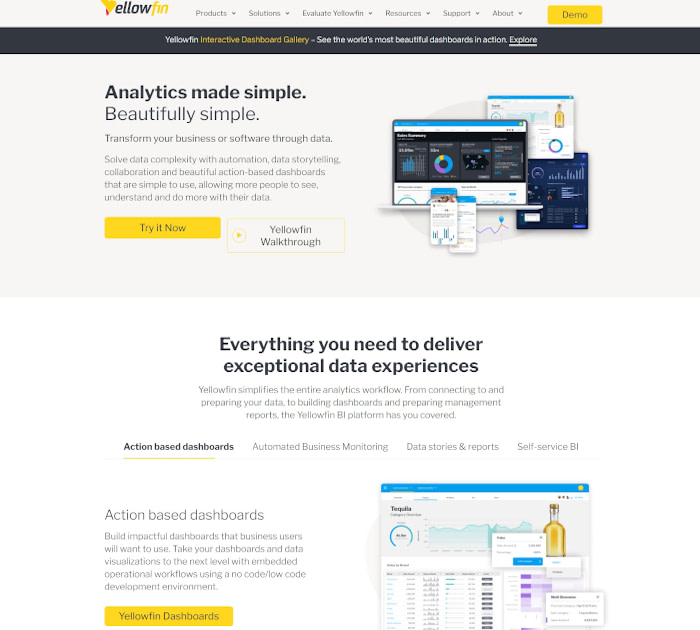
? Pricing:
Price available on request. It’s based on the number of users and required CPU cores. A 30-day free trial is available.
? Key features:
- Action-based dashboards with embedded operational workflows.
- Explore and visualize data.
- Automate key parts of the analytics.
- Threshold-based alerts and AI driven signals.
- Professional management driven reports and presentations.
- Intuitive self-service BI options.
- Advanced Reports Builder and Quick Charts.
- Guided natural language query.
- Embedded analytics.
- Used by 29000+ companies worldwide.
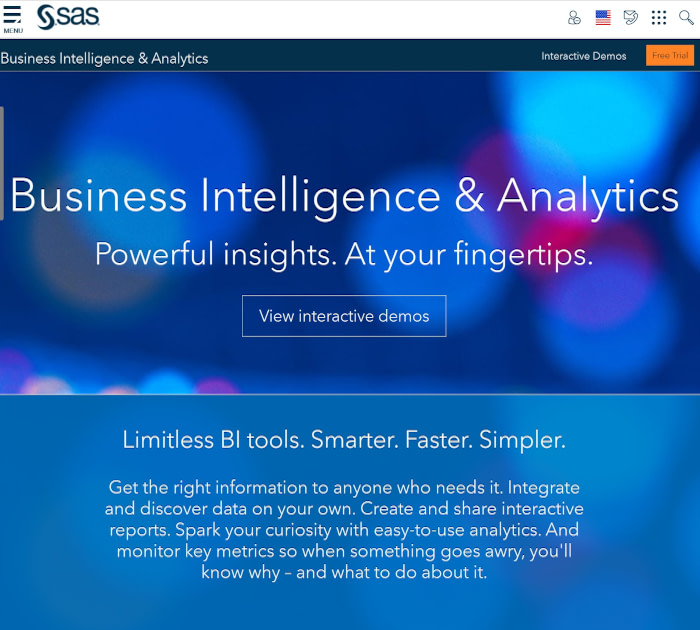
? Pricing:
14 day free trial, price available only on request. Estimated at about $8000/ year – $9000/year.
? Key features:
- Visual data exploration with rich visuals.
- Visual analytics that helps to spot trends easily.
- Self-service, ad-hoc reporting environment.
- Business user generated content for better governance.
- Built-in capabilities for data access, filtering, mashups and transformation.
- Surfacing results and key insights in Microsoft Office applications.
- Interactive commenting and annotations.
- Native apps for Android and iOS.
- Share business intelligence insights with stakeholders.
- Speed up creativity and innovation.
? Pricing:
Basic Plan at $219/mo for one user and three data sources. To increase the number of users, try Professional at $399/mo, Premium at $699/mo and Embedded at $999/mo.
? Key features:
- Scalable SaaS business intelligence solution with access from anywhere.
- Develop data-driven workflows and decision making.
- Design dashboards by function, industry or platform.
- Fast and easy data connectors.
- True self-service analytic features.
- Multiple effective reporting options.
- Modern predictive analytics tools.
- Intelligent, AI-based data alerts.
- Intuitive drag-and-drop interface.
- Advanced sharing and publishing options.
Or start the conversation in our Facebook group for WordPress professionals. Find answers, share tips, and get help from other WordPress experts. Join now (it’s free)!